Solomon Islands - Asia & the Pacific
Solomon Islands - Asia & the Pacific
Solomon Islands - Asia & the Pacific

Create successful ePaper yourself
Turn your PDF publications into a flip-book with our unique Google optimized e-Paper software.
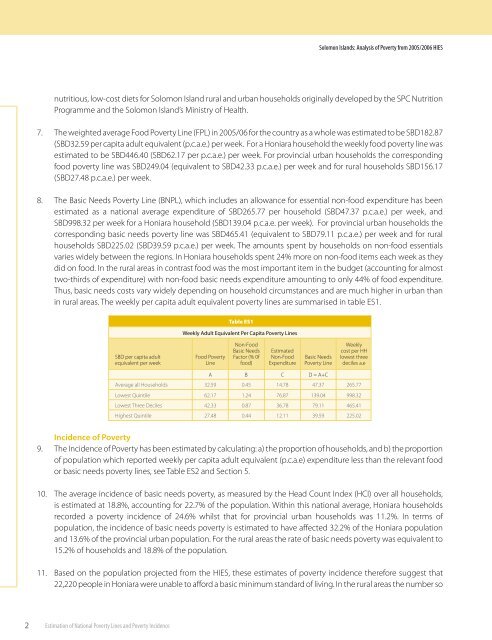
<strong>Solomon</strong> <strong>Islands</strong>: Analysis of Poverty from 2005/2006 HIESnutritious, low-cost diets for <strong>Solomon</strong> Island rural and urban households originally developed by <strong>the</strong> SPC NutritionProgramme and <strong>the</strong> <strong>Solomon</strong> Island’s Ministry of Health.7. The weighted average Food Poverty Line (FPL) in 2005/06 for <strong>the</strong> country as a whole was estimated to be SBD182.87(SBD32.59 per capita adult equivalent (p.c.a.e.) per week. For a Honiara household <strong>the</strong> weekly food poverty line wasestimated to be SBD446.40 (SBD62.17 per p.c.a.e.) per week. For provincial urban households <strong>the</strong> correspondingfood poverty line was SBD249.04 (equivalent to SBD42.33 p.c.a.e.) per week and for rural households SBD156.17(SBD27.48 p.c.a.e.) per week.8. The Basic Needs Poverty Line (BNPL), which includes an allowance for essential non-food expenditure has beenestimated as a national average expenditure of SBD265.77 per household (SBD47.37 p.c.a.e.) per week, andSBD998.32 per week for a Honiara household (SBD139.04 p.c.a.e. per week). For provincial urban households <strong>the</strong>corresponding basic needs poverty line was SBD465.41 (equivalent to SBD79.11 p.c.a.e.) per week and for ruralhouseholds SBD225.02 (SBD39.59 p.c.a.e.) per week. The amounts spent by households on non-food essentialsvaries widely between <strong>the</strong> regions. In Honiara households spent 24% more on non-food items each week as <strong>the</strong>ydid on food. In <strong>the</strong> rural areas in contrast food was <strong>the</strong> most important item in <strong>the</strong> budget (accounting for almosttwo-thirds of expenditure) with non-food basic needs expenditure amounting to only 44% of food expenditure.Thus, basic needs costs vary widely depending on household circumstances and are much higher in urban thanin rural areas. The weekly per capita adult equivalent poverty lines are summarised in table ES1.Table ES1Weekly Adult Equivalent Per Capita Poverty LinesSBD per capita adultequivalent per weekFood PovertyLineNon-FoodBasic NeedsFactor (% 0ffood)EstimatedNon-FoodExpenditureBasic NeedsPoverty LineWeeklycost per HHlowest threedeciles a.eA B C D = A+CAverage all Households 32.59 0.45 14.78 47.37Lowest Quintile 62.17 1.24 76.87 139.04Lowest Three Deciles 42.33 0.87 36.78 79.11Highest Quintile 27.48 0.44 12.11 39.59265.77998.32465.41225.02Incidence of Poverty9. The Incidence of Poverty has been estimated by calculating: a) <strong>the</strong> proportion of households, and b) <strong>the</strong> proportionof population which reported weekly per capita adult equivalent (p.c.a.e) expenditure less than <strong>the</strong> relevant foodor basic needs poverty lines, see Table ES2 and Section 5.10. The average incidence of basic needs poverty, as measured by <strong>the</strong> Head Count Index (HCI) over all households,is estimated at 18.8%, accounting for 22.7% of <strong>the</strong> population. Within this national average, Honiara householdsrecorded a poverty incidence of 24.6% whilst that for provincial urban households was 11.2%. In terms ofpopulation, <strong>the</strong> incidence of basic needs poverty is estimated to have affected 32.2% of <strong>the</strong> Honiara populationand 13.6% of <strong>the</strong> provincial urban population. For <strong>the</strong> rural areas <strong>the</strong> rate of basic needs poverty was equivalent to15.2% of households and 18.8% of <strong>the</strong> population.11. Based on <strong>the</strong> population projected from <strong>the</strong> HIES, <strong>the</strong>se estimates of poverty incidence <strong>the</strong>refore suggest that22,220 people in Honiara were unable to afford a basic minimum standard of living. In <strong>the</strong> rural areas <strong>the</strong> number soEstimation of National Poverty Lines and Poverty Incidence