Solomon Islands - Asia & the Pacific
Solomon Islands - Asia & the Pacific
Solomon Islands - Asia & the Pacific
Create successful ePaper yourself
Turn your PDF publications into a flip-book with our unique Google optimized e-Paper software.
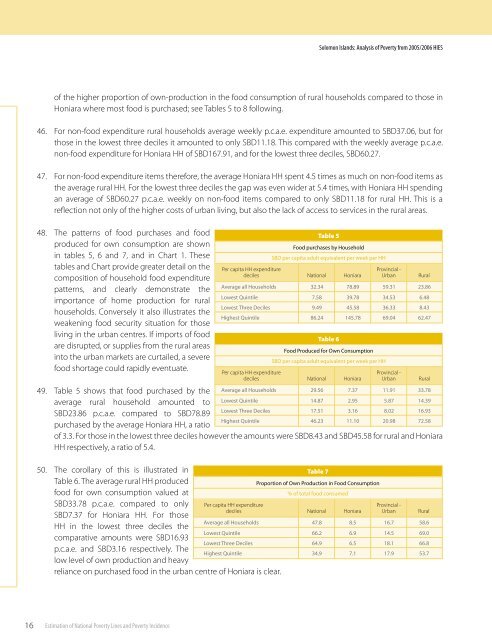
<strong>Solomon</strong> <strong>Islands</strong>: Analysis of Poverty from 2005/2006 HIESof <strong>the</strong> higher proportion of own-production in <strong>the</strong> food consumption of rural households compared to those inHoniara where most food is purchased; see Tables 5 to 8 following.46. For non-food expenditure rural households average weekly p.c.a.e. expenditure amounted to SBD37.06, but forthose in <strong>the</strong> lowest three deciles it amounted to only SBD11.18. This compared with <strong>the</strong> weekly average p.c.a.e.non-food expenditure for Honiara HH of SBD167.91, and for <strong>the</strong> lowest three deciles, SBD60.27.47. For non-food expenditure items <strong>the</strong>refore, <strong>the</strong> average Honiara HH spent 4.5 times as much on non-food items as<strong>the</strong> average rural HH. For <strong>the</strong> lowest three deciles <strong>the</strong> gap was even wider at 5.4 times, with Honiara HH spendingan average of SBD60.27 p.c.a.e. weekly on non-food items compared to only SBD11.18 for rural HH. This is areflection not only of <strong>the</strong> higher costs of urban living, but also <strong>the</strong> lack of access to services in <strong>the</strong> rural areas.48. The patterns of food purchases and foodproduced for own consumption are shownin tables 5, 6 and 7, and in Chart 1. Thesetables and Chart provide greater detail on <strong>the</strong>composition of household food expenditurepatterns, and clearly demonstrate <strong>the</strong>importance of home production for ruralhouseholds. Conversely it also illustrates <strong>the</strong>weakening food security situation for thoseliving in <strong>the</strong> urban centres. If imports of foodare disrupted, or supplies from <strong>the</strong> rural areasinto <strong>the</strong> urban markets are curtailed, a severefood shortage could rapidly eventuate.Per capita HH expendituredecilesPer capita HH expendituredecilesTable 5Food purchases by HouseholdSBD per capita adult equivalent per week per HHTable 6Food Produced for Own ConsumptionSBD per capita adult equivalent per week per HH49. Table 5 shows that food purchased by <strong>the</strong> Average all Households 29.567.3711.91 33.78average rural household amounted toLowest Quintile 14.872.955.8714.39SBD23.86 p.c.a.e. compared to SBD78.89purchased by <strong>the</strong> average Honiara HH, a ratioLowest Three DecilesHighest Quintile17.5146.233.1611.108.0220.9816.9372.58of 3.3. For those in <strong>the</strong> lowest three deciles however <strong>the</strong> amounts were SBD8.43 and SBD45.58 for rural and HoniaraHH respectively, a ratio of 5.4.NationalAverage all Households 32.34Lowest Quintile 7.58Lowest Three Deciles 9.49Highest Quintile 86.24NationalHoniara78.8939.7845.58145.78HoniaraProvincial -Urban59.3134.5336.3369.04Provincial -UrbanRural23.866.488.4362.47Rural50. The corollary of this is illustrated inTable 6. The average rural HH producedfood for own consumption valued atSBD33.78 p.c.a.e. compared to only Per capita HH expendituredecilesSBD7.37 for Honiara HH. For thoseHH in <strong>the</strong> lowest three deciles <strong>the</strong>comparative amounts were SBD16.93p.c.a.e. and SBD3.16 respectively. Thelow level of own production and heavyreliance on purchased food in <strong>the</strong> urban centre of Honiara is clear.Table 7Proportion of Own Production in Food Consumption% of total food consumedNationalAverage all Households 47.8Lowest Quintile 66.2Lowest Three Deciles 64.9Highest Quintile 34.9Honiara8.56.96.57.1Provincial -Urban16.714.518.117.9Rural58.669.066.853.716Estimation of National Poverty Lines and Poverty Incidence


