Solomon Islands - Asia & the Pacific
Solomon Islands - Asia & the Pacific
Solomon Islands - Asia & the Pacific
Create successful ePaper yourself
Turn your PDF publications into a flip-book with our unique Google optimized e-Paper software.
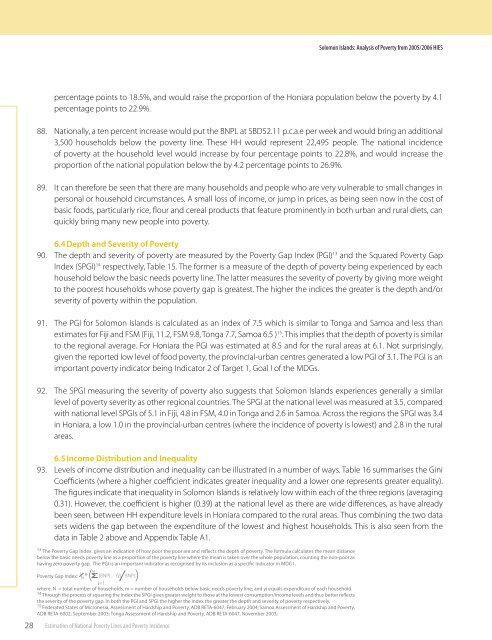
<strong>Solomon</strong> <strong>Islands</strong>: Analysis of Poverty from 2005/2006 HIES28percentage points to 18.5%, and would raise <strong>the</strong> proportion of <strong>the</strong> Honiara population below <strong>the</strong> poverty by 4.1percentage points to 22.9%.88. Nationally, a ten percent increase would put <strong>the</strong> BNPL at SBD52.11 p.c.a.e per week and would bring an additional3,500 households below <strong>the</strong> poverty line. These HH would represent 22,495 people. The national incidenceof poverty at <strong>the</strong> household level would increase by four percentage points to 22.8%, and would increase <strong>the</strong>proportion of <strong>the</strong> national population below <strong>the</strong> by 4.2 percentage points to 26.9%.89. It can <strong>the</strong>refore be seen that <strong>the</strong>re are many households and people who are very vulnerable to small changes inpersonal or household circumstances. A small loss of income, or jump in prices, as being seen now in <strong>the</strong> cost ofbasic foods, particularly rice, flour and cereal products that feature prominently in both urban and rural diets, canquickly bring many new people into poverty.6.4 Depth and Severity of Poverty90. The depth and severity of poverty are measured by <strong>the</strong> Poverty Gap Index (PGI) 13 and <strong>the</strong> Squared Poverty GapIndex (SPGI) 14 respectively, Table 15. The former is a measure of <strong>the</strong> depth of poverty being experienced by eachhousehold below <strong>the</strong> basic needs poverty line. The latter measures <strong>the</strong> severity of poverty by giving more weightto <strong>the</strong> poorest households whose poverty gap is greatest. The higher <strong>the</strong> indices <strong>the</strong> greater is <strong>the</strong> depth and/orseverity of poverty within <strong>the</strong> population.91. The PGI for <strong>Solomon</strong> <strong>Islands</strong> is calculated as an index of 7.5 which is similar to Tonga and Samoa and less thanestimates for Fiji and FSM (Fiji, 11.2, FSM 9.8, Tonga 7.7, Samoa 6.5 ) 15 . This implies that <strong>the</strong> depth of poverty is similarto <strong>the</strong> regional average. For Honiara <strong>the</strong> PGI was estimated at 8.5 and for <strong>the</strong> rural areas at 6.1. Not surprisingly,given <strong>the</strong> reported low level of food poverty, <strong>the</strong> provincial-urban centres generated a low PGI of 3.1. The PGI is animportant poverty indicator being Indicator 2 of Target 1, Goal I of <strong>the</strong> MDGs.92. The SPGI measuring <strong>the</strong> severity of poverty also suggests that <strong>Solomon</strong> <strong>Islands</strong> experiences generally a similarlevel of poverty severity as o<strong>the</strong>r regional countries. The SPGI at <strong>the</strong> national level was measured at 3.5, comparedwith national level SPGIs of 5.1 in Fiji, 4.8 in FSM, 4.0 in Tonga and 2.6 in Samoa. Across <strong>the</strong> regions <strong>the</strong> SPGI was 3.4in Honiara, a low 1.0 in <strong>the</strong> provincial-urban centres (where <strong>the</strong> incidence of poverty is lowest) and 2.8 in <strong>the</strong> ruralareas.6.5 Income Distribution and Inequality93. Levels of income distribution and inequality can be illustrated in a number of ways. Table 16 summarises <strong>the</strong> GiniCoefficients (where a higher coefficient indicates greater inequality and a lower one represents greater equality).The figures indicate that inequality in <strong>Solomon</strong> <strong>Islands</strong> is relatively low within each of <strong>the</strong> three regions (averaging0.31). However, <strong>the</strong> coefficient is higher (0.39) at <strong>the</strong> national level as <strong>the</strong>re are wide differences, as have alreadybeen seen, between HH expenditure levels in Honiara compared to <strong>the</strong> rural areas. Thus combining <strong>the</strong> two datasets widens <strong>the</strong> gap between <strong>the</strong> expenditure of <strong>the</strong> lowest and highest households. This is also seen from <strong>the</strong>data in Table 2 above and Appendix Table A1.13 The Poverty Gap Index gives an indication of how poor <strong>the</strong> poor are and reflects <strong>the</strong> depth of poverty. The formula calculates <strong>the</strong> mean distancebelow <strong>the</strong> basic needs poverty line as a proportion of <strong>the</strong> poverty line where <strong>the</strong> mean is taken over <strong>the</strong> whole population, counting <strong>the</strong> non-poor ashaving zero poverty gap. The PGI is an important indicator as recognised by its inclusion as a specific indicator in MDG1.IPoverty Gap Index: N*( M (BNPL - Yi) BNPL)i=1where: N = total number of households, m = number of households below basic needs poverty line; and yi equals expenditure of each household.14 Through <strong>the</strong> process of squaring <strong>the</strong> index <strong>the</strong> SPGI gives greater weight to those at <strong>the</strong> lowest consumption/income levels and thus better reflects<strong>the</strong> severity of <strong>the</strong> poverty gap. In both <strong>the</strong> PGI and SPGI <strong>the</strong> higher <strong>the</strong> index <strong>the</strong> greater <strong>the</strong> depth and severity of poverty respectively.15 Federated States of Micronesia, Assessment of Hardship and Poverty, ADB RETA-6047, February 2004; Samoa Assessment of Hardship and Poverty,ADB RETA-6002, September 2003; Tonga Assessment of Hardship and Poverty, ADB RETA-6047, November 2003;Estimation of National Poverty Lines and Poverty Incidence


