Solomon Islands - Asia & the Pacific
Solomon Islands - Asia & the Pacific
Solomon Islands - Asia & the Pacific

Create successful ePaper yourself
Turn your PDF publications into a flip-book with our unique Google optimized e-Paper software.
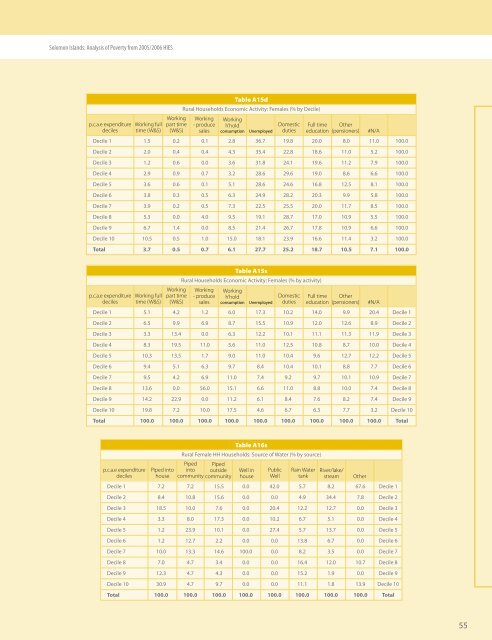
<strong>Solomon</strong> <strong>Islands</strong>: Analysis of Poverty from 2005/2006 HIESp.c.a.e expendituredecilesWorking fulltime (W&S)Workingpart time(W&S)Table A15dRural Households Economic Activity: Females (% by Decile)Working- producesalesWorkingh’holdconsumptionUnemployedDomesticdutiesFull time O<strong>the</strong>reducation (pensioners)Decile .5 0.2 0.1 2.8 36.7 19.8 20.0 8.0 11.0 100.0Decile .0 0.4 0.4 4.3 35.4 22.8 18.6 11.0 5.2 100.0Decile .2 0.6 0.0 3.6 31.8 24.1 19.6 11.2 7.9 100.0Decile .9 0.9 0.7 3.2 28.6 29.6 19.0 8.6 6.6 100.0Decile .6 0.6 0.1 5.1 28.6 24.6 16.8 12.5 8.1 100.0Decile .8 0.3 0.5 6.3 24.9 28.2 20.3 9.9 5.8 100.0Decile 7 .9 0.2 0.5 7.3 22.5 25.5 20.0 11.7 8.5 100.0Decile 8 .3 0.0 4.0 9.5 19.1 28.7 17.0 10.9 5.5 100.0Decile 9 .7 1.4 0.0 8.5 21.4 26.7 17.8 10.9 6.6 100.0Decile 10 10.5 0.5 1.0 15.0 18.1 23.9 16.6 11.4 3.2 100.0Total 3.7 0.5 0.7 6.1 27.7 25.2 18.7 10.5 7.1 100.0#N/Ap.c.a.e expendituredecilesWorking fulltime (W&S)Workingpart time(W&S)Table A15sRural Households Economic Activity: Females (% by activity)Working- producesalesWorkingh’holdconsumptionUnemployedDomesticdutiesFull time O<strong>the</strong>reducation (pensioners)Decile .1 4.2 1.2 6.0 17.3 10.2 14.0 9.9 20.4 Decile 1Decile .5 9.9 6.9 8.7 15.5 10.9 12.0 12.6 8.9 Decile 2Decile .3 13.4 0.0 6.3 12.2 10.1 11.1 11.3 11.9 Decile 3Decile 4 8.3 19.5 11.0 5.6 11.0 12.5 10.8 8.7 10.0 Decile 4Decile 0.3 13.5 1.7 9.0 11.0 10.4 9.6 12.7 12.2 Decile 5Decile 6 9.4 5.1 6.3 9.7 8.4 10.4 10.1 8.8 7.7 Decile 6Decile 7 9.5 4.2 6.9 11.0 7.4 9.2 9.7 10.1 10.9 Decile 7Decile 8 .6 0.0 56.0 15.1 6.6 11.0 8.8 10.0 7.4 Decile 8Decile 9 .2 22.9 0.0 11.2 6.1 8.4 7.6 8.2 7.4 Decile 9Decile 10 19.8 7.2 10.0 17.5 4.6 6.7 6.3 7.7 3.2 Decile 10Total 100.0 100.0 100.0 100.0 100.0 100.0 100.0 100.0 100.0 Total#N/Ap.c.a.e expendituredecilesPiped intohouseTable A16sRural Female HH Households: Source of Water (% by source)Piped Pipedinto outsidecommunity communityWell inhouseRain WatertankRiver/lake/streamDecile 1 7.2 7.2 15.5 0.0 42.0 5.7 8.2 67.6 Decile 1Decile 2 8.4 10.8 15.6 0.0 0.0 4.9 34.4 7.8 Decile 2Decile 8.5 10.0 7.6 0.0 20.4 12.2 12.7 0.0 Decile 3Decile .3 8.0 17.3 0.0 10.2 6.7 5.1 0.0 Decile 4Decile .2 23.9 10.1 0.0 27.4 5.7 13.7 0.0 Decile 5Decile .2 12.7 2.2 0.0 0.0 13.8 6.7 0.0 Decile 6Decile 7 0.0 13.3 14.6 100.0 0.0 8.2 3.5 0.0 Decile 7Decile 8 7.0 4.7 3.4 0.0 0.0 16.4 12.0 10.7 Decile 8Decile 9 .3 4.7 4.3 0.0 0.0 15.2 1.9 0.0 Decile 9Decile 10 30.9 4.7 9.7 0.0 0.0 11.1 1.8 13.9 Decile 10Total 100.0 100.0 100.0 100.0 100.0 100.0 100.0 100.0 TotalPublicWellO<strong>the</strong>r55