Solomon Islands - Asia & the Pacific
Solomon Islands - Asia & the Pacific
Solomon Islands - Asia & the Pacific

You also want an ePaper? Increase the reach of your titles
YUMPU automatically turns print PDFs into web optimized ePapers that Google loves.
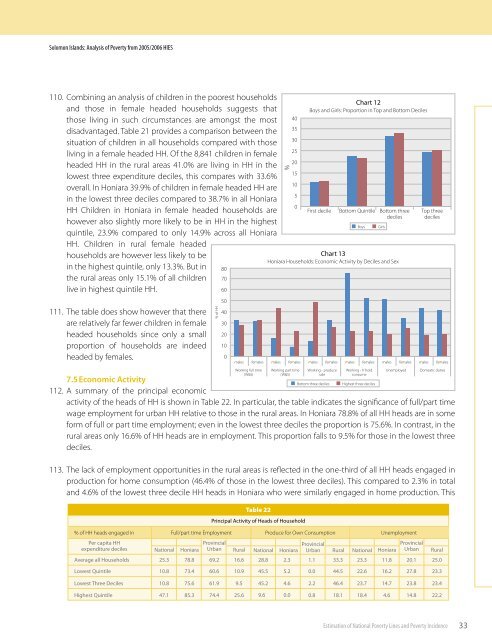
<strong>Solomon</strong> <strong>Islands</strong>: Analysis of Poverty from 2005/2006 HIES110. Combining an analysis of children in <strong>the</strong> poorest householdsand those in female headed households suggests thatthose living in such circumstances are amongst <strong>the</strong> mostdisadvantaged. Table 21 provides a comparison between <strong>the</strong>situation of children in all households compared with thoseliving in a female headed HH. Of <strong>the</strong> 8,841 children in femaleheaded HH in <strong>the</strong> rural areas 41.0% are living in HH in <strong>the</strong>lowest three expenditure deciles, this compares with 33.6%overall. In Honiara 39.9% of children in female headed HH arein <strong>the</strong> lowest three deciles compared to 38.7% in all HoniaraHH Children in Honiara in female headed households arehowever also slightly more likely to be in HH in <strong>the</strong> highestquintile, 23.9% compared to only 14.9% across all HoniaraHH. Children in rural female headedhouseholds are however less likely to bein <strong>the</strong> highest quintile, only 13.3%. But in<strong>the</strong> rural areas only 15.1% of all childrenlive in highest quintile HH.111. The table does show however that <strong>the</strong>reare relatively far fewer children in femaleheaded households since only a smallproportion of households are indeedheaded by females.7.5 Economic Activity112. A summary of <strong>the</strong> principal economic% of HH80706050403020100Chart 13Honiara Households: Economic Activity by Deciles and Sexmales females males females males females males females males females males femalesWorking full time(W&S)Working part time(W&S)Working - producesaleBottom three decilesWorking - h’ holdconsumeHighest three decilesactivity of <strong>the</strong> heads of HH is shown in Table 22. In particular, <strong>the</strong> table indicates <strong>the</strong> significance of full/part timewage employment for urban HH relative to those in <strong>the</strong> rural areas. In Honiara 78.8% of all HH heads are in someform of full or part time employment; even in <strong>the</strong> lowest three deciles <strong>the</strong> proportion is 75.6%. In contrast, in <strong>the</strong>rural areas only 16.6% of HH heads are in employment. This proportion falls to 9.5% for those in <strong>the</strong> lowest threedeciles.113. The lack of employment opportunities in <strong>the</strong> rural areas is reflected in <strong>the</strong> one-third of all HH heads engaged inproduction for home consumption (46.4% of those in <strong>the</strong> lowest three deciles). This compared to 2.3% in totaland 4.6% of <strong>the</strong> lowest three decile HH heads in Honiara who were similarly engaged in home production. ThisTable 22Principal Activity of Heads of HouseholdUnemployedDomestic duties% of HH heads engaged in Full/part time EmploymentProduce for Own ConsumptionUnemploymentPer capita HHexpenditure deciles National HoniaraProvincialUrbanRuralNationalHoniaraProvincialUrbanRuralNationalHoniaraProvincialUrbanRuralAverage all Households 25.378.869.216.628.82.31.133.323.311.820.125.0Lowest Quintile10.873.460.610.945.55.20.044.522.616.227.823.3Lowest Three Deciles10.875.661.99.545.24.62.246.423.714.723.823.4Highest Quintile47.185.374.425.69.60.00.818.118.44.614.822.2Estimation of National Poverty Lines and Poverty Incidence33