Solomon Islands - Asia & the Pacific
Solomon Islands - Asia & the Pacific
Solomon Islands - Asia & the Pacific

Create successful ePaper yourself
Turn your PDF publications into a flip-book with our unique Google optimized e-Paper software.
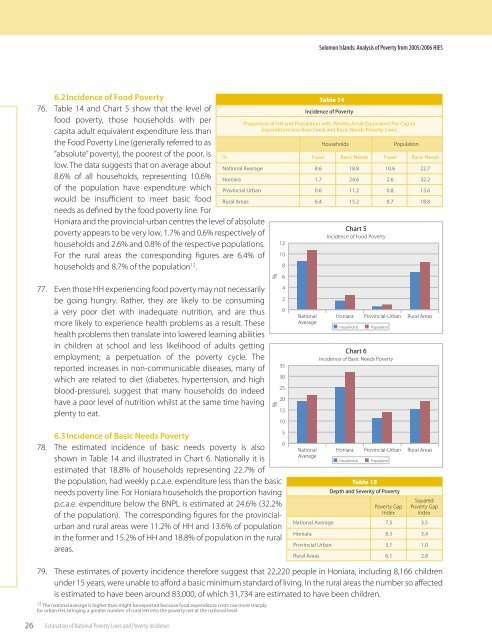
<strong>Solomon</strong> <strong>Islands</strong>: Analysis of Poverty from 2005/2006 HIES6.2 Incidence of Food Poverty76. Table 14 and Chart 5 show that <strong>the</strong> level offood poverty, those households with percapita adult equivalent expenditure less than<strong>the</strong> Food Poverty Line (generally referred to as“absolute” poverty), <strong>the</strong> poorest of <strong>the</strong> poor, islow. The data suggests that on average about8.6% of all households, representing 10.6%of <strong>the</strong> population have expenditure whichwould be insufficient to meet basic foodneeds as defined by <strong>the</strong> food poverty line. ForHoniara and <strong>the</strong> provincial-urban centres <strong>the</strong> level of absolutepoverty appears to be very low, 1.7% and 0.6% respectively ofhouseholds and 2.6% and 0.8% of <strong>the</strong> respective populations.For <strong>the</strong> rural areas <strong>the</strong> corresponding figures are 6.4% ofhouseholds and 8.7% of <strong>the</strong> population 12 .77. Even those HH experiencing food poverty may not necessarilybe going hungry. Ra<strong>the</strong>r, <strong>the</strong>y are likely to be consuminga very poor diet with inadequate nutrition, and are thusmore likely to experience health problems as a result. Thesehealth problems <strong>the</strong>n translate into lowered learning abilitiesin children at school and less likelihood of adults gettingemployment; a perpetuation of <strong>the</strong> poverty cycle. Thereported increases in non-communicable diseases, many ofwhich are related to diet (diabetes, hypertension, and highblood-pressure), suggest that many households do indeedhave a poor level of nutrition whilst at <strong>the</strong> same time havingplenty to eat.6.3 Incidence of Basic Needs Poverty078. The estimated incidence of basic needs poverty is alsoshown in Table 14 and illustrated in Chart 6. Nationally it isestimated that 18.8% of households representing 22.7% of<strong>the</strong> population, had weekly p.c.a.e. expenditure less than <strong>the</strong> basicneeds poverty line. For Honiara households <strong>the</strong> proportion havingp.c.a.e. expenditure below <strong>the</strong> BNPL is estimated at 24.6% (32.2%of <strong>the</strong> population). The corresponding figures for <strong>the</strong> provincialurbanand rural areas were 11.2% of HH and 13.6% of populationin <strong>the</strong> former and 15.2% of HH and 18.8% of population in <strong>the</strong> ruralareas.Table 15Depth and Severity of PovertyPoverty GapIndexSquaredPoverty GapIndexNational Average 7.53.5Honiara8.53.4Provincial UrbanRural Areas3.16.11.02.879. These estimates of poverty incidence <strong>the</strong>refore suggest that 22,220 people in Honiara, including 8,166 childrenunder 15 years, were unable to afford a basic minimum standard of living. In <strong>the</strong> rural areas <strong>the</strong> number so affectedis estimated to have been around 83,000, of which 31,734 are estimated to have been children.12 The national average is higher than might be expected because food expenditure costs rise more sharplyfor urban HH, bringing a greater number of rural HH into <strong>the</strong> poverty net at <strong>the</strong> national level.%3530252015105Table 14Incidence of PovertyProportion of HH and Population with Weekly Adult Equivalent Per CapitaExpenditure less than Food and Basic Needs Poverty Lines% Food Basic Needs Food Basic NeedsNational AverageHoniaraProvincial Urban8.61.70.618.824.611.210.62.60.822.732.213.6Rural Areas6.4 15.28.7 18.8%121086420NationalAverageNationalAverageHouseholdsChart 5Incidence of Food PovertyChart 6Incidence of Basic Needs PovertyHoniara Provincial-Urban Rural AreasHouseholdsPopulationPopulationHoniara Provincial-Urban Rural AreasHouseholdsPopulation26Estimation of National Poverty Lines and Poverty Incidence