Solomon Islands - Asia & the Pacific
Solomon Islands - Asia & the Pacific
Solomon Islands - Asia & the Pacific

You also want an ePaper? Increase the reach of your titles
YUMPU automatically turns print PDFs into web optimized ePapers that Google loves.
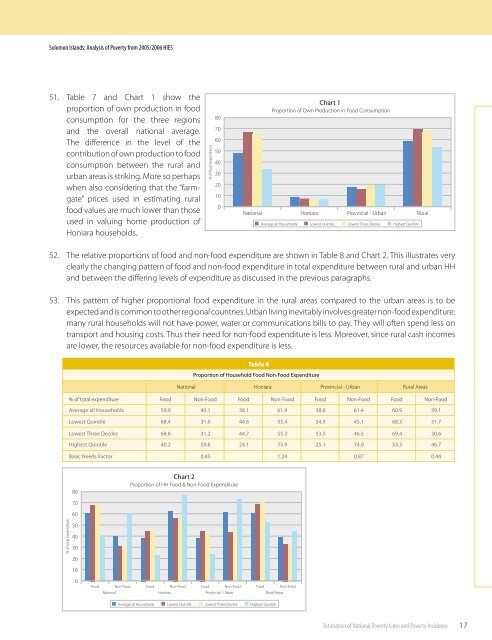
<strong>Solomon</strong> <strong>Islands</strong>: Analysis of Poverty from 2005/2006 HIES51. Table 7 and Chart 1 show <strong>the</strong>proportion of own production in foodconsumption for <strong>the</strong> three regionsand <strong>the</strong> overall national average.The difference in <strong>the</strong> level of <strong>the</strong>contribution of own production to foodconsumption between <strong>the</strong> rural andurban areas is striking. More so perhapswhen also considering that <strong>the</strong> “farmgate”prices used in estimating ruralfood values are much lower than thoseused in valuing home production ofHoniara households.% of food expenditure80706050403020100Chart 1Proportion of Own Production in Food ConsumptionNational Honiara Provincial - Urban RuralAverage all Households Lowest Quintile Lowest Three Deciles Highest Quintile52. The relative proportions of food and non-food expenditure are shown in Table 8 and Chart 2. This illustrates veryclearly <strong>the</strong> changing pattern of food and non-food expenditure in total expenditure between rural and urban HHand between <strong>the</strong> differing levels of expenditure as discussed in <strong>the</strong> previous paragraphs.53. This pattern of higher proportional food expenditure in <strong>the</strong> rural areas compared to <strong>the</strong> urban areas is to beexpected and is common to o<strong>the</strong>r regional countries. Urban living inevitably involves greater non-food expenditure;many rural households will not have power, water or communications bills to pay. They will often spend less ontransport and housing costs. Thus <strong>the</strong>ir need for non-food expenditure is less. Moreover, since rural cash incomesare lower, <strong>the</strong> resources available for non-food expenditure is less.Table 8Proportion of Household Food Non-Food ExpenditureNational Honiara Provincial - Urban Rural Areas% of total expenditure Food Non-Food FoodNon-Food Food Non-Food Food Non-FoodAverage all HouseholdsLowest QuintileLowest Three Deciles59.9 40.1 38.1 61.9 38.6 61.4 60.9 39.168.4 31.6 44.6 55.4 54.9 45.1 68.3 31.768.8 31.2 44.7 55.3 53.5 46.5 69.4 30.6Highest Quintile 40.259.8 24.1 75.9 25.1 74.9 53.3 46.7Basic Needs Factor 0.45 1.24 0.87 0.4480Chart 2Proportion of HH Food & Non-Food Expenditure7060% of total expenditure50403020100FoodNon-Food Food Non-Food Food Non-Food Food Non-FoodNational Honiara Provincial - Urban Rural AreasAverage all Households Lowest Quintile Lowest Three Deciles Highest QuintileEstimation of National Poverty Lines and Poverty Incidence17