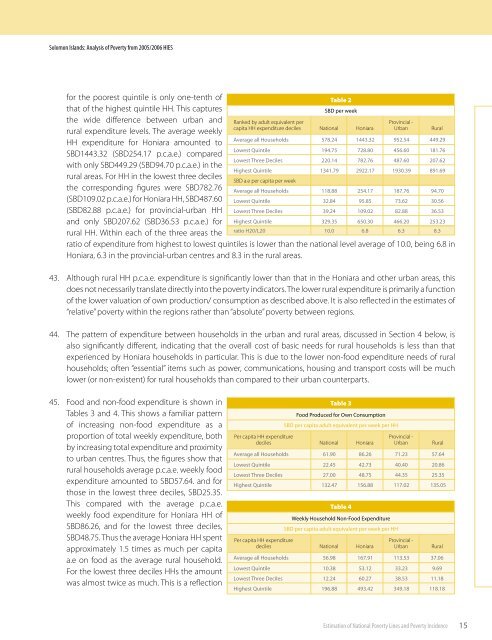
<strong>Solomon</strong> <strong>Islands</strong>: Analysis of Poverty from 2005/2006 HIESTable 1Household SizeNational Honiara Provincial - Urban Rural AreasAdult equilvalent per capita HHexpenditure quintilesActualAdultEquivalentActualAdultEquivalentActualAdultEquivalentActualAdultEquivalentAverage all Households6.24.96.95.76.55.26.04.7Lowest Quintile7.45.99.37.67.86.27.45.9Lowest Three Deciles7.05.68.87.27.45.97.15.7Highest Quintile5.14.15.44.55.14.14.53.541. The table illustrates that over <strong>the</strong> three areas of Honiara, provincial-urban centres and <strong>the</strong> rural areas, <strong>the</strong> size offamily and <strong>the</strong> number of children per HH declines with expenditure. This is a finding that is consistent with <strong>the</strong>situation in o<strong>the</strong>r parts of <strong>the</strong> <strong>Pacific</strong> region. Urban poor HH tend to be <strong>the</strong> largest and most disadvantaged, ruralHH tend to be smaller, and better-off HH in all areas tend to be smaller in overall size and number of children. Thecharacteristics of low-income/expenditure and poor households is discussed in more detail in Section 7.Box 2:National Poverty Lines; Income or ConsumptionThe ADB PerspectiveThere are two basic ingredients in measuring poverty. The first is a poverty line that refers to a benchmark level of consumption (or income) that enables aperson to attain a threshold standard of living. A person whose consumption is below this benchmark level does not attain <strong>the</strong> threshold standard of living andis <strong>the</strong>reby defined as poor. The poverty lines is said to be absolute, as opposed to relative, when <strong>the</strong> threshold standard of living is held fixed both over timeand space. Given that absolute poverty lines, and <strong>the</strong> poverty measures derived from <strong>the</strong>se, are widely believed to be <strong>the</strong> appropriate bases on which to informantipoverty policies in developing countries, <strong>the</strong> discussion focuses on <strong>the</strong>se.The second ingredient in measuring poverty is a survey that collects data on income and/or consumption levels from a sample of household’srepresentative of a given population. The choice of income or consumption as an indicator of household welfare is often determined by <strong>the</strong> availability ofdata. Where choice is available, researches have normally preferred consumption to income on <strong>the</strong> basis that <strong>the</strong> former is a better indicator of permanentincome and standard of living of people due to consumption smoothing through savings and insurance opportunities. It has also been argued that it is easierto collect information from respondents on consumption that on income. Once a poverty line has been set and survey data are available, it is a simple matterto determine how many households or people are poor.’Unfortunately, <strong>the</strong> setting of poverty lines always involves some element of subjective methodological choice. The poverty line refers to a minimum level ofliving necessary for physical and social development of a person. A minimum level of living defined in monetary terms comprises both food and non-foodcomponents of consumption. An objective approach could, in principle, be adopted for computing minimum food expenditure, <strong>the</strong> dominant component in<strong>the</strong> total consumption bundle of <strong>the</strong> poor. However, non-food expenditure is clearly affected by social needs and <strong>the</strong> minimum on this count obviously differsfrom one society (or region) to ano<strong>the</strong>r. …. it is difficult to consider even <strong>the</strong> physical component of minimum needs entirely on an objective basis. Despitesuch problems, recent literature has grown substantially to define <strong>the</strong> absolute poverty line on a reasonably, although not completely, objective basis.Once <strong>the</strong> poverty line is defined, data are required on size distribution of income or consumption to compute <strong>the</strong> number and proportion of <strong>the</strong> populationbelow <strong>the</strong> poverty line. Household income or consumption expenditure surveys are <strong>the</strong> principle source of such data….. ADB 2004b, pp 7 & 8…. Poverty lines are defined ei<strong>the</strong>r in terms of income or consumption. In practice, this choice is restricted by <strong>the</strong> availability of household survey data sincemost countries collect data on ei<strong>the</strong>r household income or consumption. A few countries … collect data on both income and consumption. Income is abetter measure of opportunity for consumption than actual consumption in <strong>the</strong> case of households that save. But consumption might be a better measure ofopportunity for poor households that save little or in fact dis-save. Most practitioners also prefer to define poverty in terms of total consumption expenditurebecause income data collection faces a wider range of measurement problems. Consumption is less affected by short-term fluctuations due to <strong>the</strong> consumptionsmoothing opportunities available to a household. Hence, total consumption expenditure is thought to be a better indicator of <strong>the</strong> permanent income of ahousehold, particularly in an agrarian economy….. ADB 2004b, p 413.2.2 Household Expenditure42. Average household expenditure by locality is shown in Table 2. This table also indicates average weekly per capitaadult equivalent (p.c.a.e.) expenditure as recorded by <strong>the</strong> survey. At <strong>the</strong> national level average p.c.a.e expenditure14Estimation of National Poverty Lines and Poverty Incidence
<strong>Solomon</strong> <strong>Islands</strong>: Analysis of Poverty from 2005/2006 HIESfor <strong>the</strong> poorest quintile is only one-tenth ofthat of <strong>the</strong> highest quintile HH. This captures<strong>the</strong> wide difference between urban andrural expenditure levels. The average weeklyHH expenditure for Honiara amounted toSBD1443.32 (SBD254.17 p.c.a.e.) comparedwith only SBD449.29 (SBD94.70 p.c.a.e.) in <strong>the</strong>rural areas. For HH in <strong>the</strong> lowest three deciles<strong>the</strong> corresponding figures were SBD782.76(SBD109.02 p.c.a.e.) for Honiara HH, SBD487.60(SBD82.88 p.c.a.e.) for provincial-urban HHand only SBD207.62 (SBD36.53 p.c.a.e.) forrural HH. Within each of <strong>the</strong> three areas <strong>the</strong>Ranked by adult equivalent percapita HH expenditure decilesTable 2SBD per weekratio of expenditure from highest to lowest quintiles is lower than <strong>the</strong> national level average of 10.0, being 6.8 inHoniara, 6.3 in <strong>the</strong> provincial-urban centres and 8.3 in <strong>the</strong> rural areas.43. Although rural HH p.c.a.e. expenditure is significantly lower than that in <strong>the</strong> Honiara and o<strong>the</strong>r urban areas, thisdoes not necessarily translate directly into <strong>the</strong> poverty indicators. The lower rural expenditure is primarily a functionof <strong>the</strong> lower valuation of own production/ consumption as described above. It is also reflected in <strong>the</strong> estimates of“relative” poverty within <strong>the</strong> regions ra<strong>the</strong>r than “absolute” poverty between regions.44. The pattern of expenditure between households in <strong>the</strong> urban and rural areas, discussed in Section 4 below, isalso significantly different, indicating that <strong>the</strong> overall cost of basic needs for rural households is less than thatexperienced by Honiara households in particular. This is due to <strong>the</strong> lower non-food expenditure needs of ruralhouseholds; often “essential” items such as power, communications, housing and transport costs will be muchlower (or non-existent) for rural households than compared to <strong>the</strong>ir urban counterparts.NationalAverage all Households 578.24Lowest Quintile 194.75Lowest Three Deciles 220.14Highest Quintile 1341.79SBD a.e per capita per weekAverage all Households 118.88Lowest Quintile 32.84Lowest Three Deciles 39.24Highest Quintile 329.35ratio H20/L20 10.0Honiara1443.32728.80782.762922.17254.1795.85109.02650.306.8Provincial -Urban952.54456.60487.601930.39187.7673.6282.88466.206.3Rural449.29181.76207.62891.6994.7030.5636.53253.238.345. Food and non-food expenditure is shown inTables 3 and 4. This shows a familiar patternof increasing non-food expenditure as aproportion of total weekly expenditure, bothby increasing total expenditure and proximityto urban centres. Thus, <strong>the</strong> figures show thatrural households average p.c.a.e. weekly foodexpenditure amounted to SBD57.64. and forthose in <strong>the</strong> lowest three deciles, SBD25.35.This compared with <strong>the</strong> average p.c.a.e.weekly food expenditure for Honiara HH ofSBD86.26, and for <strong>the</strong> lowest three deciles,SBD48.75. Thus <strong>the</strong> average Honiara HH spentapproximately 1.5 times as much per capitaa.e on food as <strong>the</strong> average rural household.For <strong>the</strong> lowest three deciles HHs <strong>the</strong> amountwas almost twice as much. This is a reflectionPer capita HH expendituredecilesPer capita HH expendituredecilesTable 3Food Produced for Own ConsumptionSBD per capita adult equivalent per week per HHNationalAverage all Households 61.90Lowest Quintile 22.45Lowest Three Deciles 27.00Highest Quintile 132.47Weekly Household Non-Food ExpenditureSBD per capita adult equivalent per week per HHNationalAverage all Households 56.98Lowest Quintile 10.38Lowest Three Deciles 12.24Highest Quintile 196.88Table 4Honiara86.2642.7348.75156.88Honiara167.9153.1260.27493.42Provincial -Urban71.2340.4044.35117.02Provincial -Urban113.5333.2338.53349.18Rural57.6420.8625.35135.05Rural37.069.6911.18118.18Estimation of National Poverty Lines and Poverty Incidence15