<strong>Solomon</strong> <strong>Islands</strong>: Analysis of Poverty from 2005/2006 HIES28percentage points to 18.5%, and would raise <strong>the</strong> proportion of <strong>the</strong> Honiara population below <strong>the</strong> poverty by 4.1percentage points to 22.9%.88. Nationally, a ten percent increase would put <strong>the</strong> BNPL at SBD52.11 p.c.a.e per week and would bring an additional3,500 households below <strong>the</strong> poverty line. These HH would represent 22,495 people. The national incidenceof poverty at <strong>the</strong> household level would increase by four percentage points to 22.8%, and would increase <strong>the</strong>proportion of <strong>the</strong> national population below <strong>the</strong> by 4.2 percentage points to 26.9%.89. It can <strong>the</strong>refore be seen that <strong>the</strong>re are many households and people who are very vulnerable to small changes inpersonal or household circumstances. A small loss of income, or jump in prices, as being seen now in <strong>the</strong> cost ofbasic foods, particularly rice, flour and cereal products that feature prominently in both urban and rural diets, canquickly bring many new people into poverty.6.4 Depth and Severity of Poverty90. The depth and severity of poverty are measured by <strong>the</strong> Poverty Gap Index (PGI) 13 and <strong>the</strong> Squared Poverty GapIndex (SPGI) 14 respectively, Table 15. The former is a measure of <strong>the</strong> depth of poverty being experienced by eachhousehold below <strong>the</strong> basic needs poverty line. The latter measures <strong>the</strong> severity of poverty by giving more weightto <strong>the</strong> poorest households whose poverty gap is greatest. The higher <strong>the</strong> indices <strong>the</strong> greater is <strong>the</strong> depth and/orseverity of poverty within <strong>the</strong> population.91. The PGI for <strong>Solomon</strong> <strong>Islands</strong> is calculated as an index of 7.5 which is similar to Tonga and Samoa and less thanestimates for Fiji and FSM (Fiji, 11.2, FSM 9.8, Tonga 7.7, Samoa 6.5 ) 15 . This implies that <strong>the</strong> depth of poverty is similarto <strong>the</strong> regional average. For Honiara <strong>the</strong> PGI was estimated at 8.5 and for <strong>the</strong> rural areas at 6.1. Not surprisingly,given <strong>the</strong> reported low level of food poverty, <strong>the</strong> provincial-urban centres generated a low PGI of 3.1. The PGI is animportant poverty indicator being Indicator 2 of Target 1, Goal I of <strong>the</strong> MDGs.92. The SPGI measuring <strong>the</strong> severity of poverty also suggests that <strong>Solomon</strong> <strong>Islands</strong> experiences generally a similarlevel of poverty severity as o<strong>the</strong>r regional countries. The SPGI at <strong>the</strong> national level was measured at 3.5, comparedwith national level SPGIs of 5.1 in Fiji, 4.8 in FSM, 4.0 in Tonga and 2.6 in Samoa. Across <strong>the</strong> regions <strong>the</strong> SPGI was 3.4in Honiara, a low 1.0 in <strong>the</strong> provincial-urban centres (where <strong>the</strong> incidence of poverty is lowest) and 2.8 in <strong>the</strong> ruralareas.6.5 Income Distribution and Inequality93. Levels of income distribution and inequality can be illustrated in a number of ways. Table 16 summarises <strong>the</strong> GiniCoefficients (where a higher coefficient indicates greater inequality and a lower one represents greater equality).The figures indicate that inequality in <strong>Solomon</strong> <strong>Islands</strong> is relatively low within each of <strong>the</strong> three regions (averaging0.31). However, <strong>the</strong> coefficient is higher (0.39) at <strong>the</strong> national level as <strong>the</strong>re are wide differences, as have alreadybeen seen, between HH expenditure levels in Honiara compared to <strong>the</strong> rural areas. Thus combining <strong>the</strong> two datasets widens <strong>the</strong> gap between <strong>the</strong> expenditure of <strong>the</strong> lowest and highest households. This is also seen from <strong>the</strong>data in Table 2 above and Appendix Table A1.13 The Poverty Gap Index gives an indication of how poor <strong>the</strong> poor are and reflects <strong>the</strong> depth of poverty. The formula calculates <strong>the</strong> mean distancebelow <strong>the</strong> basic needs poverty line as a proportion of <strong>the</strong> poverty line where <strong>the</strong> mean is taken over <strong>the</strong> whole population, counting <strong>the</strong> non-poor ashaving zero poverty gap. The PGI is an important indicator as recognised by its inclusion as a specific indicator in MDG1.IPoverty Gap Index: N*( M (BNPL - Yi) BNPL)i=1where: N = total number of households, m = number of households below basic needs poverty line; and yi equals expenditure of each household.14 Through <strong>the</strong> process of squaring <strong>the</strong> index <strong>the</strong> SPGI gives greater weight to those at <strong>the</strong> lowest consumption/income levels and thus better reflects<strong>the</strong> severity of <strong>the</strong> poverty gap. In both <strong>the</strong> PGI and SPGI <strong>the</strong> higher <strong>the</strong> index <strong>the</strong> greater <strong>the</strong> depth and severity of poverty respectively.15 Federated States of Micronesia, Assessment of Hardship and Poverty, ADB RETA-6047, February 2004; Samoa Assessment of Hardship and Poverty,ADB RETA-6002, September 2003; Tonga Assessment of Hardship and Poverty, ADB RETA-6047, November 2003;Estimation of National Poverty Lines and Poverty Incidence
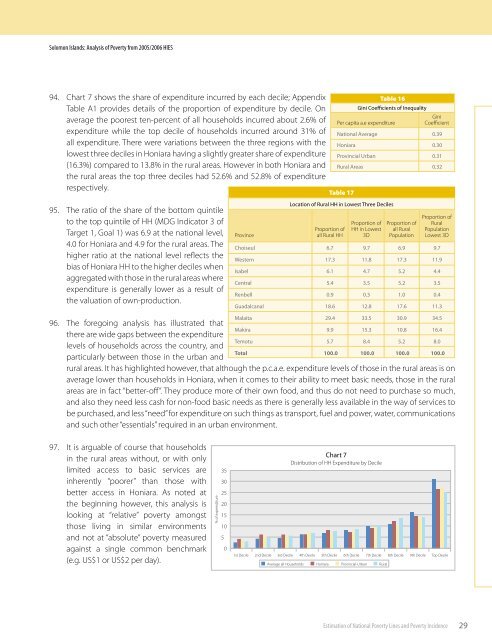
<strong>Solomon</strong> <strong>Islands</strong>: Analysis of Poverty from 2005/2006 HIES94. Chart 7 shows <strong>the</strong> share of expenditure incurred by each decile; AppendixTable A1 provides details of <strong>the</strong> proportion of expenditure by decile. Onaverage <strong>the</strong> poorest ten-percent of all households incurred about 2.6% ofexpenditure while <strong>the</strong> top decile of households incurred around 31% ofall expenditure. There were variations between <strong>the</strong> three regions with <strong>the</strong>lowest three deciles in Honiara having a slightly greater share of expenditure(16.3%) compared to 13.8% in <strong>the</strong> rural areas. However in both Honiara and<strong>the</strong> rural areas <strong>the</strong> top three deciles had 52.6% and 52.8% of expenditurerespectively.95. The ratio of <strong>the</strong> share of <strong>the</strong> bottom quintileto <strong>the</strong> top quintile of HH (MDG Indicator 3 ofTarget 1, Goal 1) was 6.9 at <strong>the</strong> national level,4.0 for Honiara and 4.9 for <strong>the</strong> rural areas. Thehigher ratio at <strong>the</strong> national level reflects <strong>the</strong>bias of Honiara HH to <strong>the</strong> higher deciles whenaggregated with those in <strong>the</strong> rural areas whereexpenditure is generally lower as a result of<strong>the</strong> valuation of own-production.96. The foregoing analysis has illustrated that<strong>the</strong>re are wide gaps between <strong>the</strong> expenditurelevels of households across <strong>the</strong> country, andparticularly between those in <strong>the</strong> urban andProvinceTable 17Location of Rural HH in Lowest Three DecilesProportion ofall Rural HHTable 16Gini Coefficients of InequalityGiniPer capita a.e expenditureCoefficientNational Average0.39Honiara0.30Provincial Urban0.31Rural Areas0.32Proportion ofHH in Lowest3DProportion ofall RuralPopulationProportion ofRuralPopulationLowest 3DChoiseul 6.79.7 6.9 9.7Western17.311.8 17.3 11.9Isabel6.14.7 5.2 4.4Central 5.43.5 5.2 3.5Renbell 0.90.3 1.0 0.4Guadalcanal 18.612.8 17.6 11.3Malaita 29.433.5 30.9 34.5Makira 9.915.3 10.8 16.4Temotu 5.78.4 5.2 8.0Total 100.0 100.0 100.0 100.0rural areas. It has highlighted however, that although <strong>the</strong> p.c.a.e. expenditure levels of those in <strong>the</strong> rural areas is onaverage lower than households in Honiara, when it comes to <strong>the</strong>ir ability to meet basic needs, those in <strong>the</strong> ruralareas are in fact “better-off”. They produce more of <strong>the</strong>ir own food, and thus do not need to purchase so much,and also <strong>the</strong>y need less cash for non-food basic needs as <strong>the</strong>re is generally less available in <strong>the</strong> way of services tobe purchased, and less “need” for expenditure on such things as transport, fuel and power, water, communicationsand such o<strong>the</strong>r “essentials” required in an urban environment.97. It is arguable of course that householdsin <strong>the</strong> rural areas without, or with onlylimited access to basic services areinherently “poorer” than those withbetter access in Honiara. As noted at<strong>the</strong> beginning however, this analysis islooking at “relative” poverty amongstthose living in similar environmentsand not at “absolute” poverty measuredagainst a single common benchmark(e.g. US$1 or US$2 per day).% of expemditure35302520151050Chart 7Distribution of HH Expenditure by Decile1st Decile 2nd Decile 3rd Decile 4th Decile 5th Decile 6th Decile 7th Decile 8th Decile 9th Decile Top DecileAverage all Households Honiara Provincial-Urban RuralEstimation of National Poverty Lines and Poverty Incidence29