autocom-cdp-pro-for-trucks-manual-version-1.5 - Car diagnostic tool
autocom-cdp-pro-for-trucks-manual-version-1.5 - Car diagnostic tool
autocom-cdp-pro-for-trucks-manual-version-1.5 - Car diagnostic tool

Create successful ePaper yourself
Turn your PDF publications into a flip-book with our unique Google optimized e-Paper software.
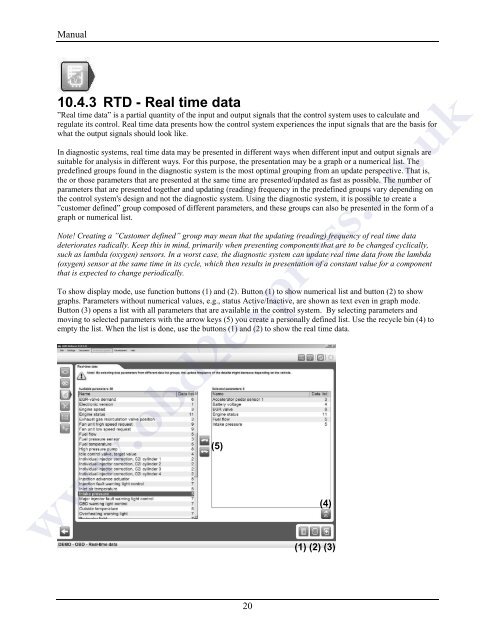
Manual10.4.3 RTD - Real time data”Real time data” is a partial quantity of the input and output signals that the control system uses to calculate andregulate its control. Real time data presents how the control system experiences the input signals that are the basis <strong>for</strong>what the output signals should look like.In <strong>diagnostic</strong> systems, real time data may be presented in different ways when different input and output signals aresuitable <strong>for</strong> analysis in different ways. For this purpose, the presentation may be a graph or a numerical list. Thepredefined groups found in the <strong>diagnostic</strong> system is the most optimal grouping from an update perspective. That is,the or those parameters that are presented at the same time are presented/updated as fast as possible. The number ofparameters that are presented together and updating (reading) frequency in the predefined groups vary depending onthe control system's design and not the <strong>diagnostic</strong> system. Using the <strong>diagnostic</strong> system, it is possible to create a”customer defined” group composed of different parameters, and these groups can also be presented in the <strong>for</strong>m of agraph or numerical list.Note! Creating a ”Customer defined” group may mean that the updating (reading) frequency of real time datadeteriorates radically. Keep this in mind, primarily when presenting components that are to be changed cyclically,such as lambda (oxygen) sensors. In a worst case, the <strong>diagnostic</strong> system can update real time data from the lambda(oxygen) sensor at the same time in its cycle, which then results in presentation of a constant value <strong>for</strong> a componentthat is expected to change periodically.To show display mode, use function buttons (1) and (2). Button (1) to show numerical list and button (2) to showgraphs. Parameters without numerical values, e.g., status Active/Inactive, are shown as text even in graph mode.Button (3) opens a list with all parameters that are available in the control system. By selecting parameters andmoving to selected parameters with the arrow keys (5) you create a personally defined list. Use the recycle bin (4) toempty the list. When the list is done, use the buttons (1) and (2) to show the real time data.(5)(4)(1) (2) (3)www.obd2express.co.uk20