autocom-cdp-pro-for-trucks-manual-version-1.5 - Car diagnostic tool
autocom-cdp-pro-for-trucks-manual-version-1.5 - Car diagnostic tool
autocom-cdp-pro-for-trucks-manual-version-1.5 - Car diagnostic tool
Create successful ePaper yourself
Turn your PDF publications into a flip-book with our unique Google optimized e-Paper software.
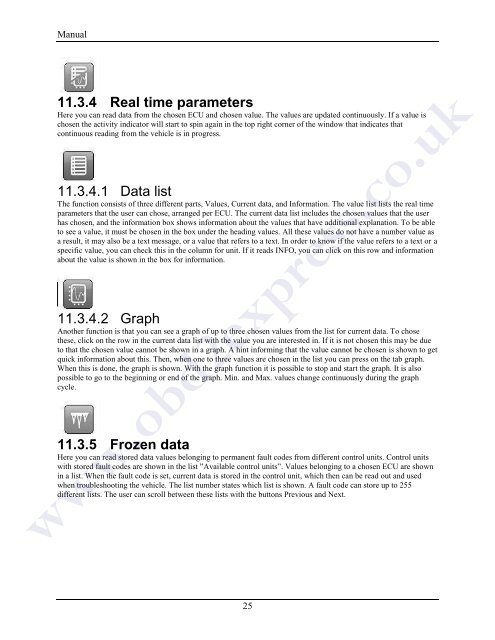
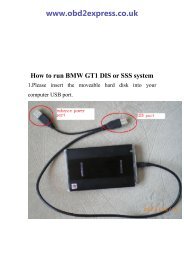
Manual11.3.4 Real time parametersHere you can read data from the chosen ECU and chosen value. The values are updated continuously. If a value ischosen the activity indicator will start to spin again in the top right corner of the window that indicates thatcontinuous reading from the vehicle is in <strong>pro</strong>gress.11.3.4.1 Data listThe function consists of three different parts, Values, Current data, and In<strong>for</strong>mation. The value list lists the real timeparameters that the user can chose, arranged per ECU. The current data list includes the chosen values that the userhas chosen, and the in<strong>for</strong>mation box shows in<strong>for</strong>mation about the values that have additional explanation. To be ableto see a value, it must be chosen in the box under the heading values. All these values do not have a number value asa result, it may also be a text message, or a value that refers to a text. In order to know if the value refers to a text or aspecific value, you can check this in the column <strong>for</strong> unit. If it reads INFO, you can click on this row and in<strong>for</strong>mationabout the value is shown in the box <strong>for</strong> in<strong>for</strong>mation.11.3.4.2 GraphAnother function is that you can see a graph of up to three chosen values from the list <strong>for</strong> current data. To chosethese, click on the row in the current data list with the value you are interested in. If it is not chosen this may be dueto that the chosen value cannot be shown in a graph. A hint in<strong>for</strong>ming that the value cannot be chosen is shown to getquick in<strong>for</strong>mation about this. Then, when one to three values are chosen in the list you can press on the tab graph.When this is done, the graph is shown. With the graph function it is possible to stop and start the graph. It is alsopossible to go to the beginning or end of the graph. Min. and Max. values change continuously during the graphcycle.11.3.5 Frozen dataHere you can read stored data values belonging to permanent fault codes from different control units. Control unitswith stored fault codes are shown in the list ”Available control units”. Values belonging to a chosen ECU are shownin a list. When the fault code is set, current data is stored in the control unit, which then can be read out and usedwhen troubleshooting the vehicle. The list number states which list is shown. A fault code can store up to 255different lists. The user can scroll between these lists with the buttons Previous and Next.www.obd2express.co.uk25


