

PMFA1
PMFA1
PMFA1

You also want an ePaper? Increase the reach of your titles
YUMPU automatically turns print PDFs into web optimized ePapers that Google loves.
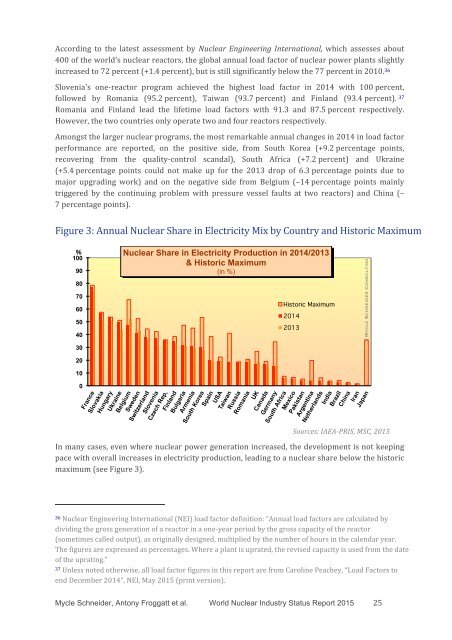
According to the latest assessment by Nuclear Engineering International, which assesses about400 of the world’s nuclear reactors, the global annual load factor of nuclear power plants slightlyincreased to 72 percent (+1.4 percent), but is still significantly below the 77 percent in 2010. 36Slovenia's one‐reactor program achieved the highest load factor in 2014 with 100 percent,followed by Romania (95.2 percent), Taiwan (93.7 percent) and Finland (93.4 percent). 37Romania and Finland lead the lifetime load factors with 91.3 and 87.5 percent respectively.However, the two countries only operate two and four reactors respectively.Amongst the larger nuclear programs, the most remarkable annual changes in 2014 in load factorperformance are reported, on the positive side, from South Korea (+9.2 percentage points,recovering from the quality‐control scandal), South Africa (+7.2 percent) and Ukraine(+5.4 percentage points could not make up for the 2013 drop of 6.3 percentage points due tomajor upgrading work) and on the negative side from Belgium (–14 percentage points mainlytriggered by the continuing problem with pressure vessel faults at two reactors) and China (–7 percentage points).Figure 3: Annual Nuclear Share in Electricity Mix by Country and Historic Maximum% Nuclear Share in Electricity Production in 2014/2013100& Historic Maximum90(in %)807060504030Historic Maximum20142013© Mycle Schneider Consulting20100Sources: IAEA‐PRIS, MSC, 2015In many cases, even where nuclear power generation increased, the development is not keepingpace with overall increases in electricity production, leading to a nuclear share below the historicmaximum (see Figure 3).36 Nuclear Engineering International (NEI) load factor definition: “Annual load factors are calculated bydividing the gross generation of a reactor in a one‐year period by the gross capacity of the reactor(sometimes called output), as originally designed, multiplied by the number of hours in the calendar year.The figures are expressed as percentages. Where a plant is uprated, the revised capacity is used from the dateof the uprating.”37 Unless noted otherwise, all load factor figures in this report are from Caroline Peachey, “Load Factors toend December 2014”, NEI, May 2015 (print version).Mycle Schneider, Antony Froggatt et al. World Nuclear Industry Status Report 2015 25