Women and Men in the Caribbean Community
Facts and Figures, 1980-2001 - CARICOM Statistics
Facts and Figures, 1980-2001 - CARICOM Statistics

Create successful ePaper yourself
Turn your PDF publications into a flip-book with our unique Google optimized e-Paper software.
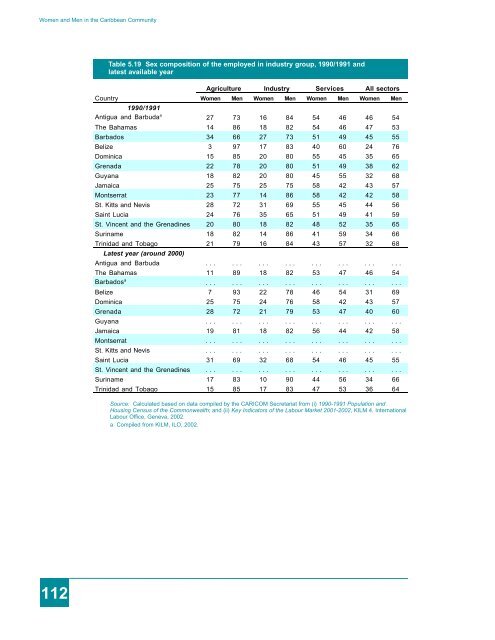
<strong>Women</strong> <strong>and</strong> <strong>Men</strong> <strong>in</strong> <strong>the</strong> <strong>Caribbean</strong> <strong>Community</strong>Table 5.19 Sex composition of <strong>the</strong> employed <strong>in</strong> <strong>in</strong>dustry group, 1990/1991 <strong>and</strong>latest available yearAgriculture Industry Services All sectorsCountry <strong>Women</strong> <strong>Men</strong> <strong>Women</strong> <strong>Men</strong> <strong>Women</strong> <strong>Men</strong> <strong>Women</strong> <strong>Men</strong>1990/1991Antigua <strong>and</strong> Barbuda a 27 73 16 84 54 46 46 54The Bahamas 14 86 18 82 54 46 47 53Barbados 34 66 27 73 51 49 45 55Belize 3 97 17 83 40 60 24 76Dom<strong>in</strong>ica 15 85 20 80 55 45 35 65Grenada 22 78 20 80 51 49 38 62Guyana 18 82 20 80 45 55 32 68Jamaica 25 75 25 75 58 42 43 57Montserrat 23 77 14 86 58 42 42 58St. Kitts <strong>and</strong> Nevis 28 72 31 69 55 45 44 56Sa<strong>in</strong>t Lucia 24 76 35 65 51 49 41 59St. V<strong>in</strong>cent <strong>and</strong> <strong>the</strong> Grenad<strong>in</strong>es 20 80 18 82 48 52 35 65Sur<strong>in</strong>ame 18 82 14 86 41 59 34 66Tr<strong>in</strong>idad <strong>and</strong> Tobago 21 79 16 84 43 57 32 68Latest year (around 2000)Antigua <strong>and</strong> Barbuda . . . . . . . . . . . . . . . . . . . . . . . .The Bahamas 11 89 18 82 53 47 46 54Barbados a . . . . . . . . . . . . . . . . . . . . . . . .Belize 7 93 22 78 46 54 31 69Dom<strong>in</strong>ica 25 75 24 76 58 42 43 57Grenada 28 72 21 79 53 47 40 60Guyana . . . . . . . . . . . . . . . . . . . . . . . .Jamaica 19 81 18 82 56 44 42 58Montserrat . . . . . . . . . . . . . . . . . . . . . . . .St. Kitts <strong>and</strong> Nevis . . . . . . . . . . . . . . . . . . . . . . . .Sa<strong>in</strong>t Lucia 31 69 32 68 54 46 45 55St. V<strong>in</strong>cent <strong>and</strong> <strong>the</strong> Grenad<strong>in</strong>es . . . . . . . . . . . . . . . . . . . . . . . .Sur<strong>in</strong>ame 17 83 10 90 44 56 34 66Tr<strong>in</strong>idad <strong>and</strong> Tobago 15 85 17 83 47 53 36 64Source: Calculated based on data compiled by <strong>the</strong> CARICOM Secretariat from (i) 1990-1991 Population <strong>and</strong>Hous<strong>in</strong>g Census of <strong>the</strong> Commonwealth; <strong>and</strong> (ii) Key Indicators of <strong>the</strong> Labour Market 2001-2002, KILM 4. InternationalLabour Office, Geneva, 2002.a Compiled from KILM, ILO, 2002.112