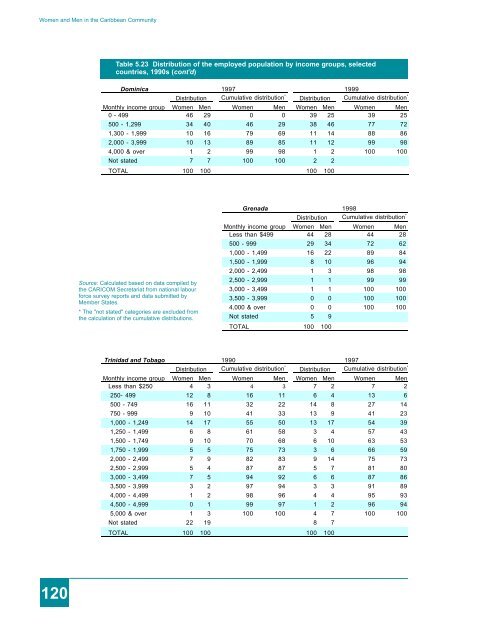
<strong>Women</strong> <strong>and</strong> <strong>Men</strong> <strong>in</strong> <strong>the</strong> <strong>Caribbean</strong> <strong>Community</strong>Table 5.23 Distribution of <strong>the</strong> employed population by <strong>in</strong>come groups, selectedcountries, 1990s (cont’d)Dom<strong>in</strong>ica1997 1999Distribution Cumulative distribution * Distribution Cumulative distribution *Monthly <strong>in</strong>come group <strong>Women</strong> <strong>Men</strong> <strong>Women</strong> <strong>Men</strong> <strong>Women</strong> <strong>Men</strong> <strong>Women</strong> <strong>Men</strong>0 - 499 46 29 0 0 39 25 39 25500 - 1,299 34 40 46 29 38 46 77 721,300 - 1,999 10 16 79 69 11 14 88 862,000 - 3,999 10 13 89 85 11 12 99 984,000 & over 1 2 99 98 1 2 100 100Not stated 7 7 100 100 2 2TOTAL 100 100 100 100Source: Calculated based on data compiled by<strong>the</strong> CARICOM Secretariat from national labourforce survey reports <strong>and</strong> data submitted byMember States.* The "not stated" categories are excluded from<strong>the</strong> calculation of <strong>the</strong> cumulative distributions.Grenada1998Distribution Cumulative distribution *Monthly <strong>in</strong>come group <strong>Women</strong> <strong>Men</strong> <strong>Women</strong> <strong>Men</strong>Less than $499 44 28 44 28500 - 999 29 34 72 621,000 - 1,499 16 22 89 841,500 - 1,999 8 10 96 942,000 - 2,499 1 3 98 982,500 - 2,999 1 1 99 993,000 - 3,499 1 1 100 1003,500 - 3,999 0 0 100 1004,000 & over 0 0 100 100Not stated 5 9TOTAL 100 100Tr<strong>in</strong>idad <strong>and</strong> Tobago19901997Distribution Cumulative distribution * Distribution Cumulative distribution *Monthly <strong>in</strong>come group <strong>Women</strong> <strong>Men</strong> <strong>Women</strong> <strong>Men</strong> <strong>Women</strong> <strong>Men</strong> <strong>Women</strong> <strong>Men</strong>Less than $250 4 3 4 3 7 2 7 2250- 499 12 8 16 11 6 4 13 6500 - 749 16 11 32 22 14 8 27 14750 - 999 9 10 41 33 13 9 41 231,000 - 1,249 14 17 55 50 13 17 54 391,250 - 1,499 6 8 61 58 3 4 57 431,500 - 1,749 9 10 70 68 6 10 63 531,750 - 1,999 5 5 75 73 3 6 66 592,000 - 2,499 7 9 82 83 9 14 75 732,500 - 2,999 5 4 87 87 5 7 81 803,000 - 3,499 7 5 94 92 6 6 87 863,500 - 3,999 3 2 97 94 3 3 91 894,000 - 4,499 1 2 98 96 4 4 95 934,500 - 4,999 0 1 99 97 1 2 96 945,000 & over 1 3 100 100 4 7 100 100Not stated 22 19 8 7TOTAL 100 100 100 100120
Chapter 5: WORKGender Gap <strong>in</strong> Earn<strong>in</strong>gs Not Entirely Due to Differentials <strong>in</strong> Work<strong>in</strong>g HoursThe differences <strong>in</strong> women’s <strong>and</strong> men’s <strong>in</strong>comes are often expla<strong>in</strong>ed by <strong>the</strong> lower degree ofattachment that women are purported to have to <strong>the</strong> labour force (such as be<strong>in</strong>g more<strong>in</strong>volved <strong>in</strong> part-time work than men or more likely to withdraw from <strong>the</strong> labour market forfamily reasons), or <strong>the</strong>ir work <strong>in</strong> different k<strong>in</strong>ds of occupations. The ratio of women’s to men’sgross monthly <strong>in</strong>come <strong>and</strong> hourly wages for Sa<strong>in</strong>t Lucia <strong>in</strong> 1999, <strong>in</strong>dicates that except <strong>in</strong> <strong>the</strong>health <strong>and</strong> social work branches of activities, women earn 36 per cent to 91 per cent of whatmen earn (table 5.24). In four out of 11 <strong>in</strong>dustrial groups, <strong>the</strong> hourly earn<strong>in</strong>gs ratio is higherthan <strong>the</strong> gross monthly ratio by four to 8 percentage po<strong>in</strong>ts; <strong>in</strong> <strong>the</strong> o<strong>the</strong>rs <strong>the</strong>y are about <strong>the</strong>same. This suggests that while <strong>the</strong> fewer hours that women work could account for some of<strong>the</strong> gap between <strong>the</strong>ir monthly <strong>in</strong>come <strong>and</strong> that of men’s, only a small proportion can beattributed to this. In general, women’s hourly earn<strong>in</strong>gs do not equal that of men <strong>in</strong> any o<strong>the</strong>rsectors, except for health <strong>and</strong> social work, where women earned about 30 per cent more thanmen, on a monthly basis, <strong>and</strong> 36 per cent more per hour.Table 5.24 Ratio of women's to men's average normal monthly <strong>and</strong> hourlygross earn<strong>in</strong>gs, Sa<strong>in</strong>t Lucia, 1999Ratio of women's to men's (%)Averagenormal gross Average hourlymonthly earn<strong>in</strong>gsIndustry groupearn<strong>in</strong>gsHealth <strong>and</strong> social work 130 136Wholesale <strong>and</strong> retail trade 90 91Education 85 89F<strong>in</strong>ancial <strong>in</strong>termediation 85 84Manufactut<strong>in</strong>g 79 77M<strong>in</strong><strong>in</strong>g <strong>and</strong> quarry<strong>in</strong>g 79 69Real estate, rent<strong>in</strong>g <strong>and</strong> bus<strong>in</strong>ess activities 77 85Hotel <strong>and</strong> restaurant 75 77Transport, storage <strong>and</strong> communication 71 72Agriculture, hunt<strong>in</strong>g <strong>and</strong> fish<strong>in</strong>g 51 59Construction 36 36Source: Based on data fromEarn<strong>in</strong>gs <strong>and</strong> Hours of WorkReport, Castries, Sa<strong>in</strong>t Lucia.Gaps <strong>in</strong> Earn<strong>in</strong>gs Persist with<strong>in</strong> Occupational GroupsThe women to men ratios <strong>in</strong> monthly <strong>in</strong>come for Tr<strong>in</strong>idad <strong>and</strong> Tobago also show that on average,<strong>in</strong> 1997, women earned 47 per cent (craft <strong>and</strong> related workers) to 91 per cent (clerks) ofthat of men. The situation was not a substantial improvement over <strong>the</strong> 1990 <strong>in</strong>comes. In someoccupational groups, <strong>the</strong> ratio of women’s mean <strong>in</strong>come to men’s mean <strong>in</strong>come improved bythree (professionals) to 29 (service workers) percentage po<strong>in</strong>ts; <strong>and</strong> <strong>in</strong> o<strong>the</strong>rs it decl<strong>in</strong>ed bysix (plant operators) to 15 (craft <strong>and</strong> related workers) percentage po<strong>in</strong>ts. The major <strong>in</strong>crease<strong>in</strong> women’s <strong>in</strong>come relative to men’s was <strong>in</strong> services, shop <strong>and</strong> market sales, where womenwere severely disadvantaged <strong>in</strong> 1990 (earn<strong>in</strong>g only 23 per cent of men’s <strong>in</strong>comes). In 1997,still one of <strong>the</strong> worst ratios, women earned only 52 per cent of that of men (table 5.25).121