Women and Men in the Caribbean Community
Facts and Figures, 1980-2001 - CARICOM Statistics
Facts and Figures, 1980-2001 - CARICOM Statistics

You also want an ePaper? Increase the reach of your titles
YUMPU automatically turns print PDFs into web optimized ePapers that Google loves.
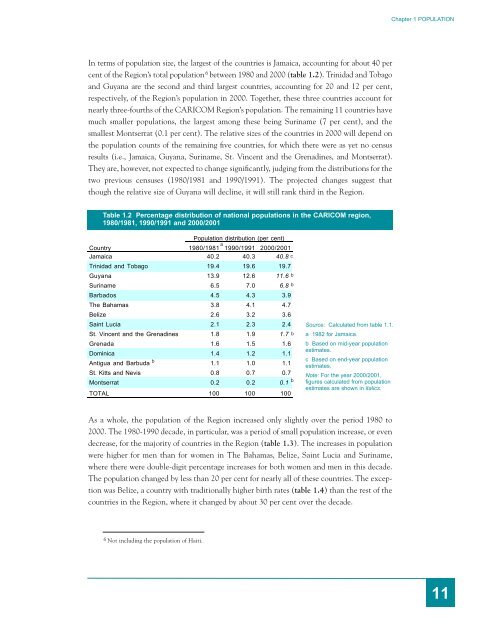
Chapter 1 POPULATIONIn terms of population size, <strong>the</strong> largest of <strong>the</strong> countries is Jamaica, account<strong>in</strong>g for about 40 percent of <strong>the</strong> Region’s total population 6 between 1980 <strong>and</strong> 2000 (table 1.2). Tr<strong>in</strong>idad <strong>and</strong> Tobago<strong>and</strong> Guyana are <strong>the</strong> second <strong>and</strong> third largest countries, account<strong>in</strong>g for 20 <strong>and</strong> 12 per cent,respectively, of <strong>the</strong> Region’s population <strong>in</strong> 2000. Toge<strong>the</strong>r, <strong>the</strong>se three countries account fornearly three-fourths of <strong>the</strong> CARICOM Region’s population. The rema<strong>in</strong><strong>in</strong>g 11 countries havemuch smaller populations, <strong>the</strong> largest among <strong>the</strong>se be<strong>in</strong>g Sur<strong>in</strong>ame (7 per cent), <strong>and</strong> <strong>the</strong>smallest Montserrat (0.1 per cent). The relative sizes of <strong>the</strong> countries <strong>in</strong> 2000 will depend on<strong>the</strong> population counts of <strong>the</strong> rema<strong>in</strong><strong>in</strong>g five countries, for which <strong>the</strong>re were as yet no censusresults (i.e., Jamaica, Guyana, Sur<strong>in</strong>ame, St. V<strong>in</strong>cent <strong>and</strong> <strong>the</strong> Grenad<strong>in</strong>es, <strong>and</strong> Montserrat).They are, however, not expected to change significantly, judg<strong>in</strong>g from <strong>the</strong> distributions for <strong>the</strong>two previous censuses (1980/1981 <strong>and</strong> 1990/1991). The projected changes suggest thatthough <strong>the</strong> relative size of Guyana will decl<strong>in</strong>e, it will still rank third <strong>in</strong> <strong>the</strong> Region.Table 1.2 Percentage distribution of national populations <strong>in</strong> <strong>the</strong> CARICOM region,1980/1981, 1990/1991 <strong>and</strong> 2000/2001Population distribution (per cent)Countrya1980/1981 1990/1991 2000/2001Jamaica 40.2 40.3 40.8 cTr<strong>in</strong>idad <strong>and</strong> Tobago 19.4 19.6 19.7Guyana 13.9 12.6 11.6 bSur<strong>in</strong>ame 6.5 7.0 6.8 bBarbados 4.5 4.3 3.9The Bahamas 3.8 4.1 4.7Belize 2.6 3.2 3.6Sa<strong>in</strong>t Lucia 2.1 2.3 2.4St. V<strong>in</strong>cent <strong>and</strong> <strong>the</strong> Grenad<strong>in</strong>es 1.8 1.9 1.7 bGrenada 1.6 1.5 1.6Dom<strong>in</strong>ica 1.4 1.2 1.1bAntigua <strong>and</strong> Barbuda 1.1 1.0 1.1St. Kitts <strong>and</strong> Nevis 0.8 0.7 0.7Montserrat 0.2 0.2b0.1TOTAL 100 100 100Source: Calculated from table 1.1.a 1982 for Jamaica.b Based on mid-year populationestimates.c Based on end-year populationestimates.Note: For <strong>the</strong> year 2000/2001,figures calculated from populationestimates are shown <strong>in</strong> italics.As a whole, <strong>the</strong> population of <strong>the</strong> Region <strong>in</strong>creased only slightly over <strong>the</strong> period 1980 to2000. The 1980-1990 decade, <strong>in</strong> particular, was a period of small population <strong>in</strong>crease, or evendecrease, for <strong>the</strong> majority of countries <strong>in</strong> <strong>the</strong> Region (table 1.3). The <strong>in</strong>creases <strong>in</strong> populationwere higher for men than for women <strong>in</strong> The Bahamas, Belize, Sa<strong>in</strong>t Lucia <strong>and</strong> Sur<strong>in</strong>ame,where <strong>the</strong>re were double-digit percentage <strong>in</strong>creases for both women <strong>and</strong> men <strong>in</strong> this decade.The population changed by less than 20 per cent for nearly all of <strong>the</strong>se countries. The exceptionwas Belize, a country with traditionally higher birth rates (table 1.4) than <strong>the</strong> rest of <strong>the</strong>countries <strong>in</strong> <strong>the</strong> Region, where it changed by about 30 per cent over <strong>the</strong> decade.6 Not <strong>in</strong>clud<strong>in</strong>g <strong>the</strong> population of Haiti.11