Women and Men in the Caribbean Community
Facts and Figures, 1980-2001 - CARICOM Statistics
Facts and Figures, 1980-2001 - CARICOM Statistics

Create successful ePaper yourself
Turn your PDF publications into a flip-book with our unique Google optimized e-Paper software.
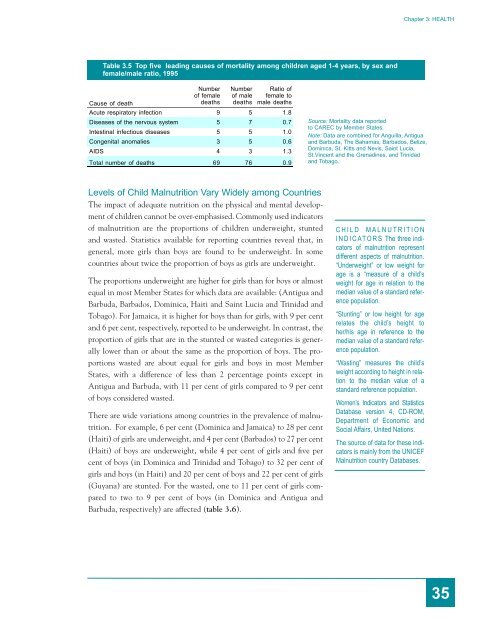
Chapter 3: HEALTHTable 3.5 Top five lead<strong>in</strong>g causes of mortality among children aged 1-4 years, by sex <strong>and</strong>female/male ratio, 1995Cause of deathNumberof femaledeathsNumberof maledeathsRatio offemale tomale deathsAcute respiratory <strong>in</strong>fection 9 5 1.8Diseases of <strong>the</strong> nervous system 5 7 0.7Intest<strong>in</strong>al <strong>in</strong>fectious diseases 5 5 1.0Congenital anomalies 3 5 0.6AIDS 4 3 1.3Total number of deaths 69 76 0.9Source: Mortality data reportedto CAREC by Member States.Note: Data are comb<strong>in</strong>ed for Anguilla, Antigua<strong>and</strong> Barbuda, The Bahamas, Barbados, Belize,Dom<strong>in</strong>ica, St. Kitts <strong>and</strong> Nevis, Sa<strong>in</strong>t Lucia,St.V<strong>in</strong>cent <strong>and</strong> <strong>the</strong> Grenad<strong>in</strong>es, <strong>and</strong> Tr<strong>in</strong>idad<strong>and</strong> Tobago.Levels of Child Malnutrition Vary Widely among CountriesThe impact of adequate nutrition on <strong>the</strong> physical <strong>and</strong> mental developmentof children cannot be over-emphasised. Commonly used <strong>in</strong>dicatorsof malnutrition are <strong>the</strong> proportions of children underweight, stunted<strong>and</strong> wasted. Statistics available for report<strong>in</strong>g countries reveal that, <strong>in</strong>general, more girls than boys are found to be underweight. In somecountries about twice <strong>the</strong> proportion of boys as girls are underweight.The proportions underweight are higher for girls than for boys or almostequal <strong>in</strong> most Member States for which data are available: (Antigua <strong>and</strong>Barbuda, Barbados, Dom<strong>in</strong>ica, Haiti <strong>and</strong> Sa<strong>in</strong>t Lucia <strong>and</strong> Tr<strong>in</strong>idad <strong>and</strong>Tobago). For Jamaica, it is higher for boys than for girls, with 9 per cent<strong>and</strong> 6 per cent, respectively, reported to be underweight. In contrast, <strong>the</strong>proportion of girls that are <strong>in</strong> <strong>the</strong> stunted or wasted categories is generallylower than or about <strong>the</strong> same as <strong>the</strong> proportion of boys. The proportionswasted are about equal for girls <strong>and</strong> boys <strong>in</strong> most MemberStates, with a difference of less than 2 percentage po<strong>in</strong>ts except <strong>in</strong>Antigua <strong>and</strong> Barbuda, with 11 per cent of girls compared to 9 per centof boys considered wasted.There are wide variations among countries <strong>in</strong> <strong>the</strong> prevalence of malnutrition.For example, 6 per cent (Dom<strong>in</strong>ica <strong>and</strong> Jamaica) to 28 per cent(Haiti) of girls are underweight, <strong>and</strong> 4 per cent (Barbados) to 27 per cent(Haiti) of boys are underweight, while 4 per cent of girls <strong>and</strong> five percent of boys (<strong>in</strong> Dom<strong>in</strong>ica <strong>and</strong> Tr<strong>in</strong>idad <strong>and</strong> Tobago) to 32 per cent ofgirls <strong>and</strong> boys (<strong>in</strong> Haiti) <strong>and</strong> 20 per cent of boys <strong>and</strong> 22 per cent of girls(Guyana) are stunted. For <strong>the</strong> wasted, one to 11 per cent of girls comparedto two to 9 per cent of boys (<strong>in</strong> Dom<strong>in</strong>ica <strong>and</strong> Antigua <strong>and</strong>Barbuda, respectively) are affected (table 3.6).CHILD MALNUTRITIONINDICATORS The three <strong>in</strong>dicatorsof malnutrition representdifferent aspects of malnutrition.“Underweight” or low weight forage is a “measure of a child’sweight for age <strong>in</strong> relation to <strong>the</strong>median value of a st<strong>and</strong>ard referencepopulation.“Stunt<strong>in</strong>g” or low height for agerelates <strong>the</strong> child’s height toher/his age <strong>in</strong> reference to <strong>the</strong>median value of a st<strong>and</strong>ard referencepopulation.“Wast<strong>in</strong>g” measures <strong>the</strong> child’sweight accord<strong>in</strong>g to height <strong>in</strong> relationto <strong>the</strong> median value of ast<strong>and</strong>ard reference population.<strong>Women</strong>’s Indicators <strong>and</strong> StatisticsDatabase version 4, CD-ROM,Department of Economic <strong>and</strong>Social Affairs, United Nations.The source of data for <strong>the</strong>se <strong>in</strong>dicatorsis ma<strong>in</strong>ly from <strong>the</strong> UNICEFMalnutrition country Databases.35