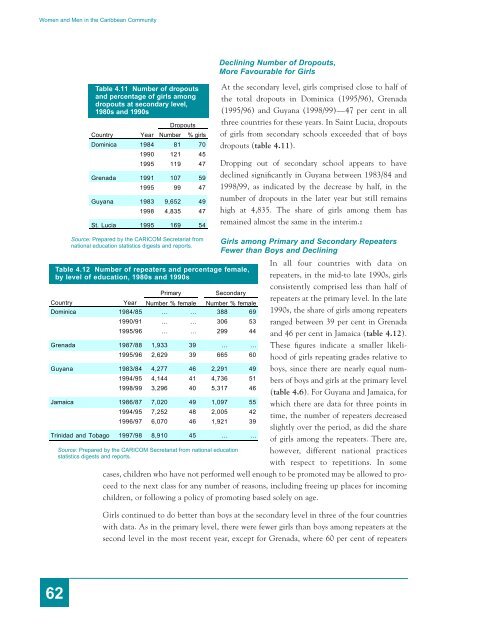
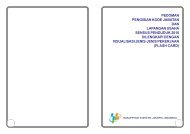
<strong>Women</strong> <strong>and</strong> <strong>Men</strong> <strong>in</strong> <strong>the</strong> <strong>Caribbean</strong> <strong>Community</strong>Decl<strong>in</strong><strong>in</strong>g Number of Dropouts,More Favourable for GirlsTable 4.11 Number of dropouts<strong>and</strong> percentage of girls amongdropouts at secondary level,1980s <strong>and</strong> 1990sDropoutsCountry Year Number % girlsDom<strong>in</strong>ica 1984 81 701990 121 451995 119 47Grenada 1991 107 591995 99 47Guyana 1983 9,652 491998 4,835 47St. Lucia 1995 169 54At <strong>the</strong> secondary level, girls comprised close to half of<strong>the</strong> total dropouts <strong>in</strong> Dom<strong>in</strong>ica (1995/96), Grenada(1995/96) <strong>and</strong> Guyana (1998/99)—47 per cent <strong>in</strong> allthree countries for <strong>the</strong>se years. In Sa<strong>in</strong>t Lucia, dropoutsof girls from secondary schools exceeded that of boysdropouts (table 4.11).Dropp<strong>in</strong>g out of secondary school appears to havedecl<strong>in</strong>ed significantly <strong>in</strong> Guyana between 1983/84 <strong>and</strong>1998/99, as <strong>in</strong>dicated by <strong>the</strong> decrease by half, <strong>in</strong> <strong>the</strong>number of dropouts <strong>in</strong> <strong>the</strong> later year but still rema<strong>in</strong>shigh at 4,835. The share of girls among <strong>the</strong>m hasrema<strong>in</strong>ed almost <strong>the</strong> same <strong>in</strong> <strong>the</strong> <strong>in</strong>terim.zSource: Prepared by <strong>the</strong> CARICOM Secretariat fromnational education statistics digests <strong>and</strong> reports.Table 4.12 Number of repeaters <strong>and</strong> percentage female,by level of education, 1980s <strong>and</strong> 1990sPrimaryCountryYear Number % female Number % femaleDom<strong>in</strong>ica 1984/85 … … 388 691990/91 … … 306 531995/96 … … 299 44Grenada 1987/88 1,933 39 … …1995/96 2,629 39 665 60Guyana 1983/84 4,277 46 2,291 491994/95 4,144 41 4,736 511998/99 3,296 40 5,317 46Jamaica 1986/87 7,020 49 1,097 551994/95 7,252 48 2,005 421996/97 6,070 46 1,921 39Tr<strong>in</strong>idad <strong>and</strong> Tobago 1997/98 8,910 45 … …Source: Prepared by <strong>the</strong> CARICOM Secretariat from national educationstatistics digests <strong>and</strong> reports.Girls among Primary <strong>and</strong> Secondary RepeatersFewer than Boys <strong>and</strong> Decl<strong>in</strong><strong>in</strong>gSecondaryIn all four countries with data onrepeaters, <strong>in</strong> <strong>the</strong> mid-to late 1990s, girlsconsistently comprised less than half ofrepeaters at <strong>the</strong> primary level. In <strong>the</strong> late1990s, <strong>the</strong> share of girls among repeatersranged between 39 per cent <strong>in</strong> Grenada<strong>and</strong> 46 per cent <strong>in</strong> Jamaica (table 4.12).These figures <strong>in</strong>dicate a smaller likelihoodof girls repeat<strong>in</strong>g grades relative toboys, s<strong>in</strong>ce <strong>the</strong>re are nearly equal numbersof boys <strong>and</strong> girls at <strong>the</strong> primary level(table 4.6). For Guyana <strong>and</strong> Jamaica, forwhich <strong>the</strong>re are data for three po<strong>in</strong>ts <strong>in</strong>time, <strong>the</strong> number of repeaters decreasedslightly over <strong>the</strong> period, as did <strong>the</strong> shareof girls among <strong>the</strong> repeaters. There are,however, different national practiceswith respect to repetitions. In somecases, children who have not performed well enough to be promoted may be allowed to proceedto <strong>the</strong> next class for any number of reasons, <strong>in</strong>clud<strong>in</strong>g free<strong>in</strong>g up places for <strong>in</strong>com<strong>in</strong>gchildren, or follow<strong>in</strong>g a policy of promot<strong>in</strong>g based solely on age.Girls cont<strong>in</strong>ued to do better than boys at <strong>the</strong> secondary level <strong>in</strong> three of <strong>the</strong> four countrieswith data. As <strong>in</strong> <strong>the</strong> primary level, <strong>the</strong>re were fewer girls than boys among repeaters at <strong>the</strong>second level <strong>in</strong> <strong>the</strong> most recent year, except for Grenada, where 60 per cent of repeaters62
Chapter 4: EDUCATION AND TRAININGwere girls. However, this was not <strong>the</strong> case <strong>in</strong> <strong>the</strong> past. For <strong>the</strong> three countries that providedsecondary level data for three periods (Dom<strong>in</strong>ica, Guyana <strong>and</strong> Jamaica), <strong>the</strong> share of girlsamong repeaters is seen to be much higher <strong>in</strong> <strong>the</strong> earlier years, exceed<strong>in</strong>g half of allrepeaters. Only <strong>in</strong> <strong>the</strong> recent period did <strong>the</strong> share of girls among repeaters drop to less than50 per cent. Given that girls dom<strong>in</strong>ate second level enrolment, <strong>the</strong>ir low share amongrepeaters shows that <strong>the</strong>ir performance is even better than what <strong>the</strong> percentages suggest.Repetition of grades <strong>in</strong> primary level decl<strong>in</strong>ed <strong>in</strong> <strong>the</strong> recent past <strong>in</strong> Guyana <strong>and</strong> Jamaica <strong>and</strong><strong>in</strong>creased <strong>in</strong> Grenada, while <strong>in</strong> <strong>the</strong> secondary level, repetition of grades decreased <strong>in</strong>Dom<strong>in</strong>ica (from 1984/85 through to 1995/96) <strong>and</strong> Jamaica (from 1994/95 through to1996/97) <strong>and</strong> <strong>in</strong>creased <strong>in</strong> Guyana (from 1994/95 to 1998/99).Education PerformanceIndicators employed to establish performance <strong>in</strong> <strong>the</strong> school population relate to <strong>the</strong> outcomesof education pursued, measured <strong>in</strong> terms of <strong>the</strong> exam<strong>in</strong>ations sat for <strong>and</strong> passed. Thissection looks at students who sat for <strong>the</strong> <strong>Caribbean</strong> Exam<strong>in</strong>ations Council (CXC) basicproficiency <strong>and</strong> general proficiency exam<strong>in</strong>ations <strong>and</strong> <strong>the</strong>ir outcomes.General ProficiencyLow Performances <strong>in</strong> General Proficiency Exam<strong>in</strong>ationsIn 2000, <strong>the</strong>re were 348,516 general proficiency exam<strong>in</strong>ations written, 215,507 by women<strong>and</strong> 133,009 by men—62 per cent women <strong>and</strong> 38 per cent men, respectively (table 4.13).It is not possible to compare <strong>the</strong>se numbers with <strong>the</strong> totals from 1994 (because no data wereavailable <strong>in</strong> 1994 on <strong>the</strong> subjects English A, English B, Electricity <strong>and</strong> Electronics, <strong>and</strong>many more). In 1994, for <strong>the</strong> subjects for which data were available, <strong>the</strong>re were more menthan women sitt<strong>in</strong>g for <strong>the</strong> General Proficiency exams. This is consistent with <strong>the</strong> muchhigher number of female than male students enrolled at <strong>the</strong> secondary level.English was <strong>the</strong> subject attract<strong>in</strong>g <strong>the</strong> highest number of female c<strong>and</strong>idates <strong>in</strong> 2000,followed by office procedures <strong>and</strong> related subjects, ma<strong>the</strong>matics, natural <strong>and</strong> <strong>in</strong>tegratedsciences <strong>and</strong> social studies. Male c<strong>and</strong>idates were also drawn to English, followed by ma<strong>the</strong>matics,office procedures <strong>and</strong> related subjects, natural <strong>and</strong> <strong>in</strong>tegrated sciences, geography<strong>and</strong> <strong>Caribbean</strong> history. <strong>Women</strong> constituted <strong>the</strong> majority of exam<strong>in</strong>ees <strong>in</strong> all subjects, exceptelectricity <strong>and</strong> electronics, <strong>and</strong> technical draw<strong>in</strong>g, where men grossly outnumbered <strong>the</strong>m.Better Performance by <strong>Women</strong> Especially <strong>in</strong> Arts <strong>and</strong>Social Sciences—<strong>Men</strong> Do<strong>in</strong>g Equally Well <strong>in</strong> French <strong>and</strong> SpanishOverall, women performed better than men both <strong>in</strong> terms of obta<strong>in</strong><strong>in</strong>g Grade 1 passes <strong>and</strong>Grades 1, 2 <strong>and</strong> 3 passes comb<strong>in</strong>ed <strong>in</strong> 2000, with exceptions <strong>in</strong> some subjects. In 2000,9 per cent of all female exam<strong>in</strong>ees obta<strong>in</strong>ed Grade 1 passes compared to 7 per cent of maleexam<strong>in</strong>ees, <strong>and</strong> 60 per cent of women obta<strong>in</strong>ed Grades 1, 2 or 3 passes, compared to only53 per cent of men. These percentages are a substantial drop from <strong>the</strong> 1994 levels, <strong>and</strong> <strong>the</strong>drop is present <strong>in</strong> nearly all subjects. The only exceptions are <strong>in</strong> agriculture where <strong>the</strong>63