Women and Men in the Caribbean Community
Facts and Figures, 1980-2001 - CARICOM Statistics
Facts and Figures, 1980-2001 - CARICOM Statistics

You also want an ePaper? Increase the reach of your titles
YUMPU automatically turns print PDFs into web optimized ePapers that Google loves.
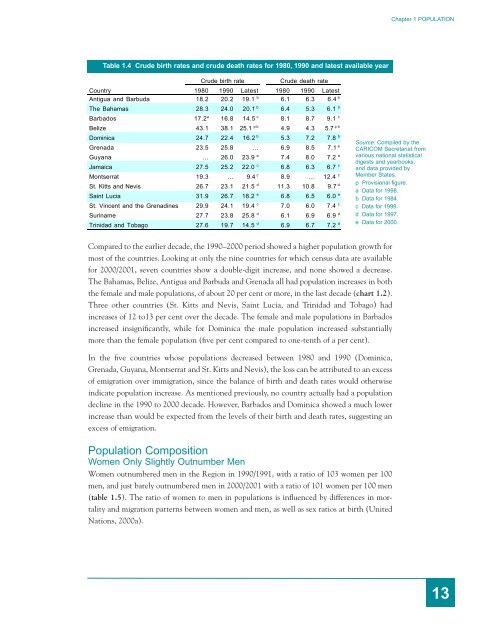
Chapter 1 POPULATIONTable 1.4 Crude birth rates <strong>and</strong> crude death rates for 1980, 1990 <strong>and</strong> latest available yearCrude birth rateCrude death rateCountry1980 1990 Latest 1980 1990 LatestAntigua <strong>and</strong> Barbuda 18.2 20.2 19.1 b 6.1 6.3 6.4 bThe Bahamas 28.3 24.0 20.1 b 6.4 5.3 6.1 bBarbados 17.2 a 16.8 14.5 c 8.1 8.7 9.1 cBelize 43.1 38.1 25.1 p b 4.9 4.3 5.7 p bDom<strong>in</strong>ica 24.7 22.4 16.2 b 5.3 7.2 7.8 bGrenada 23.5 25.8 … 6.9 8.5 7.1 eGuyana … 26.0 23.9 e 7.4 8.0 7.2 eJamaica 27.5 25.2 22.0 c 6.8 6.3 6.7 cMontserrat 19.3 … 9.4 c 8.9 … 12.4 cSt. Kitts <strong>and</strong> Nevis 26.7 23.1 21.5 d 11.3 10.8 9.7 dSa<strong>in</strong>t Lucia 31.9 26.7 18.2 e 6.8 6.5 6.0 eSt. V<strong>in</strong>cent <strong>and</strong> <strong>the</strong> Grenad<strong>in</strong>es 29.9 24.1 19.4 c 7.0 6.0 7.4 cSur<strong>in</strong>ame 27.7 23.8 25.8 d 6.1 6.9 6.9 dTr<strong>in</strong>idad <strong>and</strong> Tobago 27.6 19.7 14.5 d 6.9 6.7 7.2 dSource: Compiled by <strong>the</strong>CARICOM Secretariat fromvarious national statisticaldigests <strong>and</strong> yearbooks,<strong>and</strong> data provided byMember States.p Provisional figure.a Data for 1998.b Data for 1984.c Data for 1999.d Data for 1997.e Data for 2000.Compared to <strong>the</strong> earlier decade, <strong>the</strong> 1990–2000 period showed a higher population growth formost of <strong>the</strong> countries. Look<strong>in</strong>g at only <strong>the</strong> n<strong>in</strong>e countries for which census data are availablefor 2000/2001, seven countries show a double-digit <strong>in</strong>crease, <strong>and</strong> none showed a decrease.The Bahamas, Belize, Antigua <strong>and</strong> Barbuda <strong>and</strong> Grenada all had population <strong>in</strong>creases <strong>in</strong> both<strong>the</strong> female <strong>and</strong> male populations, of about 20 per cent or more, <strong>in</strong> <strong>the</strong> last decade (chart 1.2).Three o<strong>the</strong>r countries (St. Kitts <strong>and</strong> Nevis, Sa<strong>in</strong>t Lucia, <strong>and</strong> Tr<strong>in</strong>idad <strong>and</strong> Tobago) had<strong>in</strong>creases of 12 to13 per cent over <strong>the</strong> decade. The female <strong>and</strong> male populations <strong>in</strong> Barbados<strong>in</strong>creased <strong>in</strong>significantly, while for Dom<strong>in</strong>ica <strong>the</strong> male population <strong>in</strong>creased substantiallymore than <strong>the</strong> female population (five per cent compared to one-tenth of a per cent).In <strong>the</strong> five countries whose populations decreased between 1980 <strong>and</strong> 1990 (Dom<strong>in</strong>ica,Grenada, Guyana, Montserrat <strong>and</strong> St. Kitts <strong>and</strong> Nevis), <strong>the</strong> loss can be attributed to an excessof emigration over immigration, s<strong>in</strong>ce <strong>the</strong> balance of birth <strong>and</strong> death rates would o<strong>the</strong>rwise<strong>in</strong>dicate population <strong>in</strong>crease. As mentioned previously, no country actually had a populationdecl<strong>in</strong>e <strong>in</strong> <strong>the</strong> 1990 to 2000 decade. However, Barbados <strong>and</strong> Dom<strong>in</strong>ica showed a much lower<strong>in</strong>crease than would be expected from <strong>the</strong> levels of <strong>the</strong>ir birth <strong>and</strong> death rates, suggest<strong>in</strong>g anexcess of emigration.Population Composition<strong>Women</strong> Only Slightly Outnumber <strong>Men</strong><strong>Women</strong> outnumbered men <strong>in</strong> <strong>the</strong> Region <strong>in</strong> 1990/1991, with a ratio of 103 women per 100men, <strong>and</strong> just barely outnumbered men <strong>in</strong> 2000/2001 with a ratio of 101 women per 100 men(table 1.5). The ratio of women to men <strong>in</strong> populations is <strong>in</strong>fluenced by differences <strong>in</strong> mortality<strong>and</strong> migration patterns between women <strong>and</strong> men, as well as sex ratios at birth (UnitedNations, 2000a).13