Acknowledgements
New England Patriots Activity Guide.qxp - Pro Football Hall of Fame
New England Patriots Activity Guide.qxp - Pro Football Hall of Fame
- No tags were found...
Create successful ePaper yourself
Turn your PDF publications into a flip-book with our unique Google optimized e-Paper software.
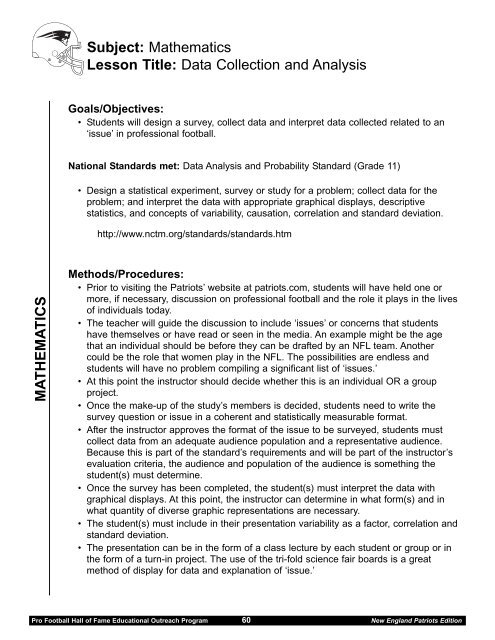
Subject: MathematicsLesson Title: Data Collection and AnalysisGoals/Objectives:• Students will design a survey, collect data and interpret data collected related to an‘issue’ in professional football.National Standards met: Data Analysis and Probability Standard (Grade 11)• Design a statistical experiment, survey or study for a problem; collect data for theproblem; and interpret the data with appropriate graphical displays, descriptivestatistics, and concepts of variability, causation, correlation and standard deviation.http://www.nctm.org/standards/standards.htmMATHEMATICSMethods/Procedures:• Prior to visiting the Patriots’ website at patriots.com, students will have held one ormore, if necessary, discussion on professional football and the role it plays in the livesof individuals today.• The teacher will guide the discussion to include ‘issues’ or concerns that studentshave themselves or have read or seen in the media. An example might be the agethat an individual should be before they can be drafted by an NFL team. Anothercould be the role that women play in the NFL. The possibilities are endless andstudents will have no problem compiling a significant list of ‘issues.’• At this point the instructor should decide whether this is an individual OR a groupproject.• Once the make-up of the study’s members is decided, students need to write thesurvey question or issue in a coherent and statistically measurable format.• After the instructor approves the format of the issue to be surveyed, students mustcollect data from an adequate audience population and a representative audience.Because this is part of the standard’s requirements and will be part of the instructor’sevaluation criteria, the audience and population of the audience is something thestudent(s) must determine.• Once the survey has been completed, the student(s) must interpret the data withgraphical displays. At this point, the instructor can determine in what form(s) and inwhat quantity of diverse graphic representations are necessary.• The student(s) must include in their presentation variability as a factor, correlation andstandard deviation.• The presentation can be in the form of a class lecture by each student or group or inthe form of a turn-in project. The use of the tri-fold science fair boards is a greatmethod of display for data and explanation of ‘issue.’Pro Football Hall of Fame Educational Outreach Program 60 New England Patriots Edition


