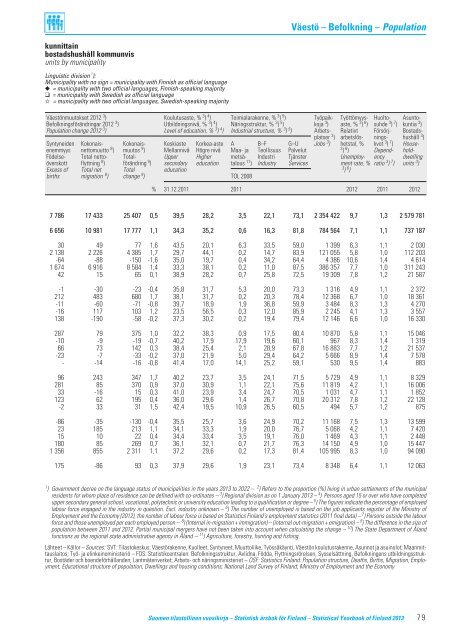
Väestö – Befolkning – Population kunnittain bostadshushåll kommunvis units by municipality Linguistic division 1 ): Municipality with no sign = municipality with Finnish as official language ◆ = municipality with two official languages, Finnish-speaking majority ❑ = municipality with Swedish as official language ✩ = municipality with two official languages, Swedish-speaking majority Väestönmuutokset 2012 3 ) Koulutusaste, % 3 ) 4 ) Toimialarakenne, % 3 ) 5 ) Työpaik- Työttömyys- Huolto- Asunto- Befolkningsförändringar 2012 3 ) Utbildningsnivå, % 3 ) 4 ) Näringsstruktur, % 3 ) 5 ) koja 3 ) aste, % 3 ) 6 ) suhde 3 ) 7 ) kuntia 3 ) Population change 2012 3 ) Level of education, % 3 ) 4 ) Industrial structure, % 3 ) 5 ) Arbets- Relativt Försörj- Bostadsplatser 3 ) arbetslös- nings- hushåll 3 ) Syntyneiden Kokonais- Kokonais- Keskiaste Korkea-aste A B–F G–U Jobs 3 ) hetstal, % kvot 3 ) 7 ) Houseenemmyys nettomuutto 8 ) muutos 9 ) Mellannivå Högre nivå Maa- ja Teollisuus Palvelut 3 ) 6 ) Depend- hold- Födelse- Total netto- Total- Upper Higher metsä- Industri Tjänster Unemploy- ency dwelling överskott flyttning 8 ) förändring 9 ) secondary education talous 11 ) Industry Services ment rate, % ratio 3 ) 7 ) units 3 ) Excess of Total net Total education 3 ) 6 ) births migration 8 ) change 9 ) TOL 2008 % 31.12.2011 2011 2012 2011 2012 7 786 17 433 25 407 0,5 39,5 28,2 3,5 22,1 73,1 2 354 422 9,7 1,3 2 579 781 6 656 10 981 17 777 1,1 34,3 35,2 0,6 16,3 81,8 784 564 7,1 1,1 737 187 30 49 77 1,6 43,5 20,1 6,3 33,5 59,0 1 399 6,3 1,1 2 030 2 138 2 226 4 385 1,7 29,7 44,1 0,2 14,7 83,9 121 055 5,8 1,0 112 203 -64 -88 -150 -1,6 35,0 19,7 0,4 34,2 64,4 4 386 10,6 1,4 4 614 1 674 6 916 8 584 1,4 33,3 38,1 0,2 11,0 87,5 386 357 7,7 1,0 311 243 42 15 65 0,1 38,9 28,2 0,7 25,8 72,5 19 309 7,8 1,2 21 587 -1 -30 -23 -0,4 35,8 31,7 5,3 20,0 73,3 1 316 4,9 1,1 2 372 212 483 680 1,7 38,1 31,7 0,2 20,3 78,4 12 368 6,7 1,0 18 361 -11 -60 -71 -0,8 39,7 18,9 1,9 36,8 59,9 3 484 8,3 1,3 4 270 -16 117 103 1,2 23,5 56,5 0,3 12,0 85,9 2 245 4,1 1,3 3 557 138 -190 -58 -0,2 37,3 30,2 0,2 19,4 79,4 12 146 6,6 1,0 16 330 287 79 375 1,0 32,2 38,3 0,9 17,5 80,4 10 870 5,8 1,1 15 046 -10 -9 -19 -0,7 40,2 17,9 17,9 19,6 60,1 967 8,3 1,4 1 319 66 73 142 0,3 38,4 25,4 2,1 28,9 67,8 16 883 7,7 1,2 21 537 -23 -7 -33 -0,2 37,0 21,9 5,0 29,4 64,2 5 666 8,9 1,4 7 578 - -14 -16 -0,8 41,4 17,0 14,1 25,2 59,1 530 9,5 1,4 883 96 243 347 1,7 40,2 23,7 3,5 24,1 71,5 5 729 4,9 1,1 8 329 281 85 370 0,9 37,0 30,9 1,1 22,1 75,6 11 819 4,2 1,1 16 006 33 -16 15 0,3 41,0 23,9 3,4 24,7 70,5 1 031 4,7 1,1 1 852 123 62 195 0,4 36,0 29,6 1,4 26,7 70,8 20 312 7,8 1,2 22 128 -2 33 31 1,5 42,4 19,5 10,9 26,5 60,5 494 5,7 1,2 875 -86 -35 -130 -0,4 35,5 25,7 3,6 24,9 70,2 11 168 7,5 1,3 13 599 23 185 213 1,1 34,1 33,3 1,9 20,0 76,7 5 068 4,2 1,1 7 420 15 10 22 0,4 34,4 33,4 3,5 19,1 76,0 1 469 4,3 1,1 2 448 180 85 269 0,7 36,1 32,1 0,7 21,7 76,3 14 150 4,9 1,0 15 447 1 356 855 2 311 1,1 37,2 29,6 0,2 17,3 81,4 105 995 8,3 1,0 94 090 175 -86 93 0,3 37,9 29,6 1,9 23,1 73,4 8 348 6,4 1,1 12 063 1 ) Government decree on the language status of municipalities in the years <strong>2013</strong> to 2022 – 2 ) Refers to the proportion (%) living in urban settlements of the municipal residents for whom place of residence can be defined with co-ordinates – 3 ) Regional division as on 1 January <strong>2013</strong> – 4 ) Persons aged 15 or over who have completed upper secondary general school, vocational, polytechnic or university education leading to a qualification or degree – 5 ) The figures indicate the percentage of employed labour force engaged in the industry in question. Excl. industry unknown – 6 ) The number of unemployed is based on the job applicants register of the Ministry of Employment and the Economy (2012), the number of labour force is based on Statistics <strong>Finland</strong>’s employment statistics (2011 final data) – 7 ) Persons outside the labour force and those unemployed per each employed person – 8 ) (Internal in-migration + immigration) – (internal out-migration + emigration) – 9 ) The difference in the size of population between 2011 and 2012. Partial municipal mergers have not been taken into account when calculating the change – 10 ) The State Department of Åland functions as the regional state administrative agency in Åland – 11 ) Agriculture, forestry, hunting and fishing. Lähteet – Källor – Sources: SVT: Tilastokeskus: Väestörakenne, Kuolleet, Syntyneet, Muuttoliike, Työssäkäynti, Väestön koulutusrakenne, Asunnot ja asuinolot; Maanmittauslaitos; Työ- ja elinkeinoministeriö – FOS: Statistikcentralen: Befolkningsstruktur, Avlidna, Födda, Flyttningsrörelsen, Sysselsättning, Befolkningens utbildningsstruktur, Bostäder och boendeförhållanden; Lantmäteriverket; Arbets- och näringsministeriet – OSF: Statistics <strong>Finland</strong>: Population structure, Deaths, Births, Migration, Employment, Educational structure of population, Dwellings and housing conditions; National Land Survey of <strong>Finland</strong>; Ministry of Employment and the Economy Suomen tilastollinen vuosikirja – Statistisk årsbok för <strong>Finland</strong> – Statistical <strong>Yearbook</strong> of <strong>Finland</strong> <strong>2013</strong> 79
Väestö – Befolkning – Population 40. (jatk. – forts. – cont.) Taajama- Maa- Väestö 31.12.2012 3 ) aste 2 ) 3 ) pinta-ala Befolkning 31.12.2012 3 ) Tätorts- Landareal Population at year-end 2012 3 ) Maakunta/kunta/AVI grad 2 ) 3 ) Land area Landskap/kommun/RFV Degree km 2 Kaikkiaan Maa-km 2 :ä Ruotsin- Region/municipality/AVI of Totalt kohti Ikä – Ålder – Age kielisiä 1.1.<strong>2013</strong> urban- Total Per km 2 land Svenskisation 2 ) 3 ) Per km 2 of språkiga land area 0–14 15–64 65– Swedishspeaking 31.12.2012 1.1.<strong>2013</strong> % % % % Varsinais-Suomi – Egentliga <strong>Finland</strong> . . . . . . . . . . . . . . . . . . . . 84,2 10 661,2 468 936 44,0 73 188 15,6 302 287 64,5 93 461 19,9 26 853 5,7 Aura . . . . . . . . . . . . . . . . . . . . . . 68,3 95,0 3 971 41,8 828 20,9 2 534 63,8 609 15,3 25 0,6 Kaarina – S:t Karins . . . . . . . . . . 94,5 150,4 31 363 208,6 6 131 19,5 19 841 63,3 5 391 17,2 1 261 4,0 ✩ Kemiönsaari – Kimitoön . . . . . . . 52,3 686,9 7 075 10,3 962 13,6 4 113 58,1 2 000 28,3 4 981 70,4 Koski Tl . . . . . . . . . . . . . . . . . . . . 51,7 191,5 2 450 12,8 359 14,7 1 422 58,0 669 27,3 6 0,2 Kustavi – Gustavs . . . . . . . . . . . . 37,5 165,8 889 5,4 84 9,4 530 59,6 275 30,9 10 1,1 Laitila . . . . . . . . . . . . . . . . . . . . . 67,5 531,7 8 460 15,9 1 443 17,1 5 151 60,9 1 866 22,1 28 0,3 Lieto – Lundo . . . . . . . . . . . . . . . 85,4 198,5 17 023 85,8 3 635 21,4 10 758 63,2 2 630 15,4 207 1,2 Loimaa . . . . . . . . . . . . . . . . . . . . 65,9 848,1 16 737 19,7 2 462 14,7 10 077 60,2 4 198 25,1 35 0,2 Marttila. . . . . . . . . . . . . . . . . . . . 43,0 195,3 2 017 10,3 322 16,0 1 205 59,7 490 24,3 20 1,0 Masku . . . . . . . . . . . . . . . . . . . . . 78,6 174,9 9 671 55,3 2 151 22,2 6 128 63,4 1 392 14,4 98 1,0 Mynämäki . . . . . . . . . . . . . . . . . . 65,0 519,8 7 978 15,3 1 310 16,4 4 948 62,0 1 720 21,6 54 0,7 Naantali – Nådendal . . . . . . . . . 85,1 311,5 18 824 60,4 3 112 16,5 12 030 63,9 3 682 19,6 249 1,3 Nousiainen – Nousis . . . . . . . . . 66,0 198,8 4 846 24,4 1 028 21,2 3 083 63,6 735 15,2 38 0,8 Oripää . . . . . . . . . . . . . . . . . . . . . 52,1 117,6 1 434 12,2 296 20,6 832 58,0 306 21,3 3 0,2 Paimio – Pemar. . . . . . . . . . . . . . 77,7 238,4 10 591 44,4 1 996 18,8 6 706 63,3 1 889 17,8 96 0,9 ✩ Parainen – Pargas. . . . . . . . . . . . 67,0 882,1 15 561 17,6 2 660 17,1 9 450 60,7 3 451 22,2 8 798 56,5 Pyhäranta . . . . . . . . . . . . . . . . . . 41,9 143,3 2 199 15,3 355 16,1 1 346 61,2 498 22,6 8 0,4 Pöytyä . . . . . . . . . . . . . . . . . . . . . 50,0 750,1 8 569 11,4 1 578 18,4 5 154 60,1 1 837 21,4 42 0,5 Raisio – Reso . . . . . . . . . . . . . . . 99,2 48,8 24 562 503,7 4 009 16,3 15 972 65,0 4 581 18,7 356 1,4 Rusko . . . . . . . . . . . . . . . . . . . . . 74,1 127,1 5 907 46,5 1 231 20,8 3 796 64,3 880 14,9 79 1,3 Salo. . . . . . . . . . . . . . . . . . . . . . . 74,6 1 986,5 54 858 27,6 9 128 16,6 34 114 62,2 11 616 21,2 592 1,1 Sauvo – Sagu . . . . . . . . . . . . . . . 41,6 252,5 3 033 12,0 521 17,2 1 907 62,9 605 19,9 77 2,5 Somero . . . . . . . . . . . . . . . . . . . . 55,8 667,8 9 229 13,8 1 368 14,8 5 330 57,8 2 531 27,4 47 0,5 Taivassalo – Tövsala . . . . . . . . . 39,4 140,3 1 682 12,0 217 12,9 980 58,3 485 28,8 9 0,5 Tarvasjoki . . . . . . . . . . . . . . . . . . 45,5 102,0 1 959 19,2 399 20,4 1 190 60,7 370 18,9 8 0,4 ◆ Turku – Åbo . . . . . . . . . . . . . . . . 98,9 245,7 180 225 733,6 23 089 12,8 122 616 68,0 34 520 19,2 9 645 5,4 Uusikaupunki – Nystad . . . . . . . . 75,4 502,4 15 499 30,8 2 173 14,0 9 654 62,3 3 672 23,7 67 0,4 Vehmaa. . . . . . . . . . . . . . . . . . . . 46,2 188,7 2 324 12,3 341 14,7 1 420 61,1 563 24,2 14 0,6 Satakunta . . . . . . . . . . . . . . . . . . . 82,4 7 819,2 224 934 28,8 34 195 15,2 139 868 62,2 50 871 22,6 783 0,3 Eura. . . . . . . . . . . . . . . . . . . . . . . 71,1 578,8 12 406 21,4 2 036 16,4 7 452 60,1 2 918 23,5 16 0,1 Eurajoki – Euraåminne . . . . . . . . 63,3 345,4 5 922 17,1 1 069 18,1 3 648 61,6 1 205 20,3 10 0,2 Harjavalta . . . . . . . . . . . . . . . . . . 92,8 123,5 7 486 60,6 1 081 14,4 4 436 59,3 1 969 26,3 17 0,2 Honkajoki . . . . . . . . . . . . . . . . . . 44,3 331,4 1 832 5,5 251 13,7 1 142 62,3 439 24,0 4 0,2 Huittinen . . . . . . . . . . . . . . . . . . . 68,5 532,6 10 623 19,9 1 576 14,8 6 483 61,0 2 564 24,1 11 0,1 Jämijärvi . . . . . . . . . . . . . . . . . . . 37,0 214,4 1 986 9,3 296 14,9 1 185 59,7 505 25,4 - - Kankaanpää . . . . . . . . . . . . . . . . 71,1 689,4 11 957 17,3 1 832 15,3 7 596 63,5 2 529 21,2 13 0,1 Karvia . . . . . . . . . . . . . . . . . . . . . 32,7 502,0 2 545 5,1 336 13,2 1 504 59,1 705 27,7 2 0,1 Kokemäki – Kumo . . . . . . . . . . . . 59,1 481,2 7 893 16,4 1 100 13,9 4 780 60,6 2 013 25,5 12 0,2 Köyliö – Kjulo . . . . . . . . . . . . . . . 49,6 246,1 2 750 11,2 383 13,9 1 678 61,0 689 25,1 5 0,2 Lavia . . . . . . . . . . . . . . . . . . . . . . 46,0 321,1 1 916 6,0 233 12,2 1 143 59,7 540 28,2 4 0,2 Luvia . . . . . . . . . . . . . . . . . . . . . . 63,1 169,1 3 360 19,9 614 18,3 2 014 59,9 732 21,8 23 0,7 Merikarvia – Sastmola . . . . . . . . 56,6 446,0 3 269 7,3 439 13,4 1 853 56,7 977 29,9 10 0,3 Nakkila . . . . . . . . . . . . . . . . . . . . 74,2 182,9 5 747 31,4 972 16,9 3 452 60,1 1 323 23,0 25 0,4 Pomarkku – Påmark . . . . . . . . . . 59,9 301,1 2 373 7,9 370 15,6 1 376 58,0 627 26,4 2 0,1 Pori – Björneborg . . . . . . . . . . . . 94,3 834,3 83 285 99,8 12 292 14,8 52 833 63,4 18 160 21,8 446 0,5 Rauma – Raumo . . . . . . . . . . . . . 92,0 495,6 39 842 80,4 6 023 15,1 25 260 63,4 8 559 21,5 135 0,3 Siikainen . . . . . . . . . . . . . . . . . . . 30,9 463,2 1 641 3,5 232 14,1 924 56,3 485 29,6 2 0,1 Säkylä . . . . . . . . . . . . . . . . . . . . . 84,5 160,6 4 631 28,8 683 14,7 2 813 60,7 1 135 24,5 12 0,3 Ulvila – Ulvsby . . . . . . . . . . . . . . 85,0 400,7 13 470 33,6 2 377 17,6 8 296 61,6 2 797 20,8 34 0,3 80 Suomen tilastollinen vuosikirja – Statistisk årsbok för <strong>Finland</strong> – Statistical <strong>Yearbook</strong> of <strong>Finland</strong> <strong>2013</strong>
- Page 1 and 2:
Suomen tilastollinen vuosikirja Sta
- Page 3 and 4:
Tiedustelut - Förfrågningar - Inq
- Page 5 and 6:
Sisällys Innehåll Contents Alkusa
- Page 7 and 8:
Tietojen laatu Suomen tilastollinen
- Page 9 and 10:
Taulukkoluettelo Sivu Tabellförtec
- Page 11 and 12:
Taulukkoluettelo Sivu Tabellförtec
- Page 13 and 14:
Taulukkoluettelo Sivu Tabellförtec
- Page 15 and 16:
Taulukkoluettelo Sivu Tabellförtec
- Page 17 and 18:
Taulukkoluettelo Sivu Tabellförtec
- Page 19 and 20:
Taulukkoluettelo Sivu Tabellförtec
- Page 21 and 22:
Taulukkoluettelo Sivu Tabellförtec
- Page 23 and 24:
Taulukkoluettelo Sivu Tabellförtec
- Page 25 and 26:
Taulukkoluettelo Sivu Tabellförtec
- Page 27 and 28:
List of tables Page Page 61. Famili
- Page 29 and 30: List of tables Page Page 251. New l
- Page 31 and 32: List of tables Page Page 424. Indus
- Page 33 and 34: List of tables Page Page 594. Waive
- Page 35 and 36: Kartat - Kartor - Maps Väkiluvun m
- Page 37 and 38: Kartat - Kartor - Maps Alle 15-vuot
- Page 39 and 40: Kartat - Kartor - Maps Koulutustaso
- Page 41 and 42: Kartat - Kartor - Maps Kunnallisvaa
- Page 43 and 44: Kartat - Kartor - Maps Eniten ään
- Page 45 and 46: Kartat - Kartor - Maps Kokonaishede
- Page 47 and 48: Kartat - Kartor - Maps Bruttokansan
- Page 49 and 50: Kartat - Kartor - Maps Kasvihuoneka
- Page 51 and 52: Maantieteellisiä tietoja - Geograf
- Page 53 and 54: Maantieteellisiä tietoja - Geograf
- Page 55 and 56: Maantieteellisiä tietoja - Geograf
- Page 57 and 58: Ympäristö ja luonnonvarat - Milj
- Page 59 and 60: Ympäristö ja luonnonvarat - Milj
- Page 61 and 62: Ympäristö ja luonnonvarat - Milj
- Page 63 and 64: Ympäristö ja luonnonvarat - Milj
- Page 65 and 66: Ympäristö ja luonnonvarat - Milj
- Page 67 and 68: Ympäristö ja luonnonvarat - Milj
- Page 69 and 70: Ympäristö ja luonnonvarat - Milj
- Page 71 and 72: Ympäristö ja luonnonvarat - Milj
- Page 73 and 74: Ympäristö ja luonnonvarat - Milj
- Page 75 and 76: Väestö - Befolkning - Population
- Page 77 and 78: Väestö - Befolkning - Population
- Page 79: Väestö - Befolkning - Population
- Page 83 and 84: Väestö - Befolkning - Population
- Page 85 and 86: Väestö - Befolkning - Population
- Page 87 and 88: Väestö - Befolkning - Population
- Page 89 and 90: Väestö - Befolkning - Population
- Page 91 and 92: Väestö - Befolkning - Population
- Page 93 and 94: Väestö - Befolkning - Population
- Page 95 and 96: Väestö - Befolkning - Population
- Page 97 and 98: Väestö - Befolkning - Population
- Page 99 and 100: Väestö - Befolkning - Population
- Page 101 and 102: Väestö - Befolkning - Population
- Page 103 and 104: Väestö - Befolkning - Population
- Page 105 and 106: Väestö - Befolkning - Population
- Page 107 and 108: Väestö - Befolkning - Population
- Page 109 and 110: Väestö - Befolkning - Population
- Page 111 and 112: Väestö - Befolkning - Population
- Page 113 and 114: Väestö - Befolkning - Population
- Page 115 and 116: Väestö - Befolkning - Population
- Page 117 and 118: Väestö - Befolkning - Population
- Page 119 and 120: Väestö - Befolkning - Population
- Page 121 and 122: Väestö - Befolkning - Population
- Page 123 and 124: Väestö - Befolkning - Population
- Page 125 and 126: Väestö - Befolkning - Population
- Page 127 and 128: Väestö - Befolkning - Population
- Page 129 and 130: Väestö - Befolkning - Population
- Page 131 and 132:
Väestö - Befolkning - Population
- Page 133 and 134:
Väestö - Befolkning - Population
- Page 135 and 136:
Väestö - Befolkning - Population
- Page 137 and 138:
Väestö - Befolkning - Population
- Page 139 and 140:
Väestö - Befolkning - Population
- Page 141 and 142:
Väestö - Befolkning - Population
- Page 143 and 144:
Väestö - Befolkning - Population
- Page 145 and 146:
Väestö - Befolkning - Population
- Page 147 and 148:
Väestö - Befolkning - Population
- Page 149 and 150:
Väestö - Befolkning - Population
- Page 151 and 152:
Väestö - Befolkning - Population
- Page 153 and 154:
Väestö - Befolkning - Population
- Page 155 and 156:
Väestö - Befolkning - Population
- Page 157 and 158:
Maa-, metsä- ja kalatalous - Jord-
- Page 159 and 160:
Maa-, metsä- ja kalatalous - Jord-
- Page 161 and 162:
Maa-, metsä- ja kalatalous - Jord-
- Page 163 and 164:
Maa-, metsä- ja kalatalous - Jord-
- Page 165 and 166:
Maa-, metsä- ja kalatalous - Jord-
- Page 167 and 168:
Maa-, metsä- ja kalatalous - Jord-
- Page 169 and 170:
Maa-, metsä- ja kalatalous - Jord-
- Page 171 and 172:
Maa-, metsä- ja kalatalous - Jord-
- Page 173 and 174:
Maa-, metsä- ja kalatalous - Jord-
- Page 175 and 176:
Maa-, metsä- ja kalatalous - Jord-
- Page 177 and 178:
Maa-, metsä- ja kalatalous - Jord-
- Page 179 and 180:
Maa-, metsä- ja kalatalous - Jord-
- Page 181 and 182:
Maa-, metsä- ja kalatalous - Jord-
- Page 183 and 184:
Maa-, metsä- ja kalatalous - Jord-
- Page 185 and 186:
Maa-, metsä- ja kalatalous - Jord-
- Page 187 and 188:
Yritykset - Företag - Enterprises
- Page 189 and 190:
Yritykset - Företag - Enterprises
- Page 191 and 192:
Yritykset - Företag - Enterprises
- Page 193 and 194:
Yritykset - Företag - Enterprises
- Page 195 and 196:
Yritykset - Företag - Enterprises
- Page 197 and 198:
Yritykset - Företag - Enterprises
- Page 199 and 200:
Yritykset - Företag - Enterprises
- Page 201 and 202:
Yritykset - Företag - Enterprises
- Page 203 and 204:
Yritykset - Företag - Enterprises
- Page 205 and 206:
Yritykset - Företag - Enterprises
- Page 207 and 208:
Yritykset - Företag - Enterprises
- Page 209 and 210:
Teollisuus - Industri - Manufacturi
- Page 211 and 212:
Teollisuus - Industri - Manufacturi
- Page 213 and 214:
Teollisuus - Industri - Manufacturi
- Page 215 and 216:
Teollisuus - Industri - Manufacturi
- Page 217 and 218:
Teollisuus - Industri - Manufacturi
- Page 219 and 220:
Teollisuus - Industri - Manufacturi
- Page 221 and 222:
Energia - Energi - Energy 179. Prim
- Page 223 and 224:
Energia - Energi - Energy 180. Ener
- Page 225 and 226:
Energia - Energi - Energy 184. Säh
- Page 227 and 228:
Energia - Energi - Energy 188. Teol
- Page 229 and 230:
Energia - Energi - Energy 190. Asui
- Page 231 and 232:
Rakentaminen - Byggande - Construct
- Page 233 and 234:
Rakentaminen - Byggande - Construct
- Page 235 and 236:
Asuminen - Boende - Housing 199. Ra
- Page 237 and 238:
Asuminen - Boende - Housing 202. As
- Page 239 and 240:
Asuminen - Boende - Housing 205. As
- Page 241 and 242:
Asuminen - Boende - Housing 210. As
- Page 243 and 244:
Asuminen - Boende - Housing 215. Ki
- Page 245 and 246:
Asuminen - Boende - Housing 218. As
- Page 247 and 248:
Asuminen - Boende - Housing 220. Va
- Page 249 and 250:
Kauppa - Handel - Trade 223. Kaupan
- Page 251 and 252:
Kauppa - Handel - Trade 223. (jatk.
- Page 253 and 254:
Kauppa - Handel - Trade 224. Tukku-
- Page 255 and 256:
Kauppa - Handel - Trade 227. Suurim
- Page 257 and 258:
Kauppa - Handel - Trade 230. Tuonti
- Page 259 and 260:
Kauppa - Handel - Trade 230. (jatk.
- Page 261 and 262:
Kauppa - Handel - Trade 230. (jatk.
- Page 263 and 264:
Kauppa - Handel - Trade 233. Tuonti
- Page 265 and 266:
Kauppa - Handel - Trade 235. Tuonni
- Page 267 and 268:
Kauppa - Handel - Trade 237. Tuonti
- Page 269 and 270:
Kauppa - Handel - Trade 237. (jatk.
- Page 271 and 272:
Kauppa - Handel - Trade 238. Tuonti
- Page 273 and 274:
Rahoitus ja vakuutus - Finansiering
- Page 275 and 276:
Rahoitus ja vakuutus - Finansiering
- Page 277 and 278:
Rahoitus ja vakuutus - Finansiering
- Page 279 and 280:
Rahoitus ja vakuutus - Finansiering
- Page 281 and 282:
Rahoitus ja vakuutus - Finansiering
- Page 283 and 284:
Rahoitus ja vakuutus - Finansiering
- Page 285 and 286:
Rahoitus ja vakuutus - Finansiering
- Page 287 and 288:
Rahoitus ja vakuutus - Finansiering
- Page 289 and 290:
Rahoitus ja vakuutus - Finansiering
- Page 291 and 292:
Liikenne ja matkailu - Transport oc
- Page 293 and 294:
Liikenne ja matkailu - Transport oc
- Page 295 and 296:
Liikenne ja matkailu - Transport oc
- Page 297 and 298:
Liikenne ja matkailu - Transport oc
- Page 299 and 300:
Liikenne ja matkailu - Transport oc
- Page 301 and 302:
Liikenne ja matkailu - Transport oc
- Page 303 and 304:
Liikenne ja matkailu - Transport oc
- Page 305 and 306:
Liikenne ja matkailu - Transport oc
- Page 307 and 308:
Liikenne ja matkailu - Transport oc
- Page 309 and 310:
Liikenne ja matkailu - Transport oc
- Page 311 and 312:
Liikenne ja matkailu - Transport oc
- Page 313 and 314:
Liikenne ja matkailu - Transport oc
- Page 315 and 316:
Kansantalous - Nationalräkenskaper
- Page 317 and 318:
Kansantalous - Nationalräkenskaper
- Page 319 and 320:
Kansantalous - Nationalräkenskaper
- Page 321 and 322:
Kansantalous - Nationalräkenskaper
- Page 323 and 324:
Kansantalous - Nationalräkenskaper
- Page 325 and 326:
Kansantalous - Nationalräkenskaper
- Page 327 and 328:
Kansantalous - Nationalräkenskaper
- Page 329 and 330:
Kansantalous - Nationalräkenskaper
- Page 331 and 332:
Kansantalous - Nationalräkenskaper
- Page 333 and 334:
Kansantalous - Nationalräkenskaper
- Page 335 and 336:
Julkinen talous - Offentlig ekonomi
- Page 337 and 338:
Julkinen talous - Offentlig ekonomi
- Page 339 and 340:
Julkinen talous - Offentlig ekonomi
- Page 341 and 342:
Julkinen talous - Offentlig ekonomi
- Page 343 and 344:
Julkinen talous - Offentlig ekonomi
- Page 345 and 346:
Julkinen talous - Offentlig ekonomi
- Page 347 and 348:
Julkinen talous - Offentlig ekonomi
- Page 349 and 350:
Julkinen talous - Offentlig ekonomi
- Page 351 and 352:
Julkinen talous - Offentlig ekonomi
- Page 353 and 354:
Julkinen talous - Offentlig ekonomi
- Page 355 and 356:
Julkinen talous - Offentlig ekonomi
- Page 357 and 358:
Julkinen talous - Offentlig ekonomi
- Page 359 and 360:
Julkinen talous - Offentlig ekonomi
- Page 361 and 362:
Julkinen talous - Offentlig ekonomi
- Page 363 and 364:
Julkinen talous - Offentlig ekonomi
- Page 365 and 366:
Julkinen talous - Offentlig ekonomi
- Page 367 and 368:
Julkinen talous - Offentlig ekonomi
- Page 369 and 370:
Julkinen talous - Offentlig ekonomi
- Page 371 and 372:
Julkinen talous - Offentlig ekonomi
- Page 373 and 374:
Julkinen talous - Offentlig ekonomi
- Page 375 and 376:
Julkinen talous - Offentlig ekonomi
- Page 377 and 378:
Työkokemus - Arbetserfarenhet Oppi
- Page 379 and 380:
Koulutus - Utbildning - Education 3
- Page 381 and 382:
Koulutus - Utbildning - Education 3
- Page 383 and 384:
Koulutus - Utbildning - Education 3
- Page 385 and 386:
Koulutus - Utbildning - Education 3
- Page 387 and 388:
Koulutus - Utbildning - Education 3
- Page 389 and 390:
Koulutus - Utbildning - Education 3
- Page 391 and 392:
Koulutus - Utbildning - Education 3
- Page 393 and 394:
Koulutus - Utbildning - Education 3
- Page 395 and 396:
Koulutus - Utbildning - Education 3
- Page 397 and 398:
Tiede, teknologia ja tietoyhteiskun
- Page 399 and 400:
Tiede, teknologia ja tietoyhteiskun
- Page 401 and 402:
Tiede, teknologia ja tietoyhteiskun
- Page 403 and 404:
Tiede, teknologia ja tietoyhteiskun
- Page 405 and 406:
Tiede, teknologia ja tietoyhteiskun
- Page 407 and 408:
Työmarkkinat - Arbetsmarknaden - L
- Page 409 and 410:
Työmarkkinat - Arbetsmarknaden - L
- Page 411 and 412:
Työmarkkinat - Arbetsmarknaden - L
- Page 413 and 414:
Työmarkkinat - Arbetsmarknaden - L
- Page 415 and 416:
Työmarkkinat - Arbetsmarknaden - L
- Page 417 and 418:
Työmarkkinat - Arbetsmarknaden - L
- Page 419 and 420:
Työmarkkinat - Arbetsmarknaden - L
- Page 421 and 422:
Työmarkkinat - Arbetsmarknaden - L
- Page 423 and 424:
Työmarkkinat - Arbetsmarknaden - L
- Page 425 and 426:
Työmarkkinat - Arbetsmarknaden - L
- Page 427 and 428:
Työmarkkinat - Arbetsmarknaden - L
- Page 429 and 430:
Palkat ja työvoimakustannukset - L
- Page 431 and 432:
Palkat ja työvoimakustannukset - L
- Page 433 and 434:
Palkat ja työvoimakustannukset - L
- Page 435 and 436:
Palkat ja työvoimakustannukset - L
- Page 437 and 438:
Palkat ja työvoimakustannukset - L
- Page 439 and 440:
Palkat ja työvoimakustannukset - L
- Page 441 and 442:
Palkat ja työvoimakustannukset - L
- Page 443 and 444:
Tulot ja kulutus - Inkomst och kons
- Page 445 and 446:
Tulot ja kulutus - Inkomst och kons
- Page 447 and 448:
Tulot ja kulutus - Inkomst och kons
- Page 449 and 450:
Tulot ja kulutus - Inkomst och kons
- Page 451 and 452:
Tulot ja kulutus - Inkomst och kons
- Page 453 and 454:
Tulot ja kulutus - Inkomst och kons
- Page 455 and 456:
Tulot ja kulutus - Inkomst och kons
- Page 457 and 458:
Tulot ja kulutus - Inkomst och kons
- Page 459 and 460:
Tulot ja kulutus - Inkomst och kons
- Page 461 and 462:
Tulot ja kulutus - Inkomst och kons
- Page 463 and 464:
Hinnat ja kustannukset - Priser och
- Page 465 and 466:
Hinnat ja kustannukset - Priser och
- Page 467 and 468:
Hinnat ja kustannukset - Priser och
- Page 469 and 470:
Hinnat ja kustannukset - Priser och
- Page 471 and 472:
Hinnat ja kustannukset - Priser och
- Page 473 and 474:
Hinnat ja kustannukset - Priser och
- Page 475 and 476:
Hinnat ja kustannukset - Priser och
- Page 477 and 478:
Hinnat ja kustannukset - Priser och
- Page 479 and 480:
Hinnat ja kustannukset - Priser och
- Page 481 and 482:
Hinnat ja kustannukset - Priser och
- Page 483 and 484:
Hinnat ja kustannukset - Priser och
- Page 485 and 486:
Sosiaaliturva - Socialskydd - Socia
- Page 487 and 488:
Sosiaaliturva - Socialskydd - Socia
- Page 489 and 490:
Sosiaaliturva - Socialskydd - Socia
- Page 491 and 492:
Sosiaaliturva - Socialskydd - Socia
- Page 493 and 494:
Sosiaaliturva - Socialskydd - Socia
- Page 495 and 496:
Sosiaaliturva - Socialskydd - Socia
- Page 497 and 498:
Sosiaaliturva - Socialskydd - Socia
- Page 499 and 500:
Sosiaaliturva - Socialskydd - Socia
- Page 501 and 502:
Sosiaaliturva - Socialskydd - Socia
- Page 503 and 504:
Sosiaaliturva - Socialskydd - Socia
- Page 505 and 506:
Terveys - Hälsa - Health 527. Olue
- Page 507 and 508:
Terveys - Hälsa - Health 530. Tupa
- Page 509 and 510:
Terveys - Hälsa - Health 534. Vapa
- Page 511 and 512:
Terveys - Hälsa - Health 537. Uude
- Page 513 and 514:
Terveys - Hälsa - Health 539. Amma
- Page 515 and 516:
Terveys - Hälsa - Health 543. Työ
- Page 517 and 518:
Terveys - Hälsa - Health 547. Hamm
- Page 519 and 520:
Terveys - Hälsa - Health 551. Ylei
- Page 521 and 522:
Terveys - Hälsa - Health 552. Lail
- Page 523 and 524:
Terveys - Hälsa - Health 555. Terv
- Page 525 and 526:
Terveys - Hälsa - Health 557. Erit
- Page 527 and 528:
Terveys - Hälsa - Health 560. Kuol
- Page 529 and 530:
Terveys - Hälsa - Health 561. Itse
- Page 531 and 532:
Kulttuuri ja viestintä - Kultur oc
- Page 533 and 534:
Kulttuuri ja viestintä - Kultur oc
- Page 535 and 536:
Kulttuuri ja viestintä - Kultur oc
- Page 537 and 538:
Kulttuuri ja viestintä - Kultur oc
- Page 539 and 540:
Kulttuuri ja viestintä - Kultur oc
- Page 541 and 542:
Kulttuuri ja viestintä - Kultur oc
- Page 543 and 544:
Kulttuuri ja viestintä - Kultur oc
- Page 545 and 546:
Kulttuuri ja viestintä - Kultur oc
- Page 547 and 548:
Kulttuuri ja viestintä - Kultur oc
- Page 549 and 550:
Oikeus - Rättsväsende - Justice 5
- Page 551 and 552:
Oikeus - Rättsväsende - Justice 5
- Page 553 and 554:
Oikeus - Rättsväsende - Justice 5
- Page 555 and 556:
Oikeus - Rättsväsende - Justice 5
- Page 557 and 558:
Oikeus - Rättsväsende - Justice 5
- Page 559 and 560:
Oikeus - Rättsväsende - Justice 5
- Page 561 and 562:
Oikeus - Rättsväsende - Justice 5
- Page 563 and 564:
Oikeus - Rättsväsende - Justice 6
- Page 565 and 566:
Oikeus - Rättsväsende - Justice 6
- Page 567 and 568:
Oikeus - Rättsväsende - Justice 6
- Page 569 and 570:
Oikeus - Rättsväsende - Justice 6
- Page 571 and 572:
Oikeus - Rättsväsende - Justice 6
- Page 573 and 574:
Vaalit ja yhteiskunnallinen päät
- Page 575 and 576:
Vaalit ja yhteiskunnallinen päät
- Page 577 and 578:
Vaalit ja yhteiskunnallinen päät
- Page 579 and 580:
Vaalit ja yhteiskunnallinen päät
- Page 581 and 582:
Vaalit ja yhteiskunnallinen päät
- Page 583 and 584:
Vaalit ja yhteiskunnallinen päät
- Page 585 and 586:
Ahvenanmaan maakunta - Landskapet
- Page 587 and 588:
Ahvenanmaan maakunta - Landskapet
- Page 589 and 590:
Ahvenanmaan maakunta - Landskapet
- Page 591 and 592:
Ahvenanmaan maakunta - Landskapet
- Page 593 and 594:
Ahvenanmaan maakunta - Landskapet
- Page 595 and 596:
Ulkomaat - Utlandet 648. (jatk. - f
- Page 597 and 598:
Ulkomaat - Utlandet 649. (jatk. - f
- Page 599 and 600:
Ulkomaat - Utlandet 649. (jatk. - f
- Page 601 and 602:
Ulkomaat - Utlandet 649. (jatk. - f
- Page 603 and 604:
Ulkomaat - Utlandet 650. EU-maiden
- Page 605 and 606:
Ulkomaat - Utlandet 650. (jatk. - f
- Page 607 and 608:
Ulkomaat - Utlandet 652. Suurimpien
- Page 609 and 610:
Ulkomaat - Utlandet 652. (jatk. - f
- Page 611 and 612:
Ulkomaat - Utlandet 652. (jatk. - f
- Page 613 and 614:
Ulkomaat - Utlandet 652. (jatk. - f
- Page 615 and 616:
Ulkomaat - Utlandet 652. (jatk. - f
- Page 617 and 618:
Ulkomaat - Utlandet 656. Eri uskont
- Page 619 and 620:
Ulkomaat - Utlandet 658. Väestö s
- Page 621 and 622:
Ulkomaat - Utlandet 660. Elävänä
- Page 623 and 624:
Ulkomaat - Utlandet 662. Pinta-alan
- Page 625 and 626:
Ulkomaat - Utlandet 662. (jatk.- fo
- Page 627 and 628:
Ulkomaat - Utlandet 664. Paperi, sa
- Page 629 and 630:
Ulkomaat - Utlandet 666. Energialä
- Page 631 and 632:
Ulkomaat - Utlandet 670. Sähkövoi
- Page 633 and 634:
Ulkomaat - Utlandet 672. Kasvihuone
- Page 635 and 636:
Ulkomaat - Utlandet 674. Yhdyskunta
- Page 637 and 638:
Ulkomaat - Utlandet 675. (jatk. - f
- Page 639 and 640:
Ulkomaat - Utlandet 675. (jatk. - f
- Page 641 and 642:
Ulkomaat - Utlandet 676. (jatk. - f
- Page 643 and 644:
Ulkomaat - Utlandet 677. (jatk. - f
- Page 645 and 646:
Ulkomaat - Utlandet 677. (jatk. - f
- Page 647 and 648:
Ulkomaat - Utlandet 679. Rautatiet,
- Page 649 and 650:
Ulkomaat - Utlandet 681. Tieliikenn
- Page 651 and 652:
Ulkomaat - Utlandet 683. Tietoliike
- Page 653 and 654:
Ulkomaat - Utlandet 685. Markkinahi
- Page 655 and 656:
Ulkomaat - Utlandet 686. Bruttokans
- Page 657 and 658:
Ulkomaat - Utlandet 688. Veroaste 1
- Page 659 and 660:
Ulkomaat - Utlandet 690. Asevoimat
- Page 661 and 662:
Ulkomaat - Utlandet 692. Työttöm
- Page 663 and 664:
Ulkomaat - Utlandet 695. Terveydenh
- Page 665 and 666:
Ulkomaat - Utlandet 697. Koulutus,
- Page 667 and 668:
Ulkomaat - Utlandet 699. Sanomalehd
- Page 669 and 670:
Mittayksikköjä - Måttenheter - U
- Page 671 and 672:
Mittayksikköjä - Måttenheter - U
- Page 673 and 674:
Tilastontuottajia - Statistikproduc
- Page 675 and 676:
Aakkosellinen hakemisto - toimialoi
- Page 677 and 678:
Aakkosellinen hakemisto - kotitalou
- Page 679 and 680:
Aakkosellinen hakemisto R Raaka-ain
- Page 681 and 682:
Aakkosellinen hakemisto Työpaikat
- Page 683 and 684:
Alfabetiskt register Sidnumren efte
- Page 685 and 686:
Alfabetiskt register - efter landsg
- Page 687 and 688:
Alfabetiskt register Inrikes omflyt
- Page 689 and 690:
Alfabetiskt register - medelpension
- Page 691 and 692:
Alfabetiskt register - arbetstimmar
- Page 693 and 694:
Index - violence 525-527, 549-551,
- Page 695 and 696:
Index - wages and salaries 186, 188
- Page 697 and 698:
Index Longitudes 53 Lutheran Nation
- Page 699 and 700:
Index Self-sufficiency in foodstuff
- Page 701:
Vuosikirjan tilastot piirtävät ta