100% Positive Material Identification
23mhiW2
23mhiW2

You also want an ePaper? Increase the reach of your titles
YUMPU automatically turns print PDFs into web optimized ePapers that Google loves.
Surface Processing and the Biocompatibility of Titanium (continued)<br />
resolution of 1.50 µm/Pixel. All pictures<br />
were digitized as 14 bit gray level images<br />
using standardized microscope settings<br />
and an exposure time of 1000 ms for the<br />
DAPI fluorescence filter and 2000 ms for<br />
the FITC fluorescence filter. To cover the<br />
whole titanium platelet between 18 and 29<br />
overlapping pictures were digitized and a<br />
composite of these overlapping pictures<br />
was generated using the software package<br />
ImageJ 2.44c with the 2D/3D stitching<br />
macro from Stephan Preibisch (“http://<br />
fly.mpi-cbg.de/~preibisch/stitching.<br />
html”). Composite images of FITC stained<br />
actin were assembled without further<br />
processing of the individual pictures.<br />
To improve contrast, each picture of<br />
DAPI stained nuclei was subjected to<br />
background subtraction using a “rolling<br />
ball radius” of 50 pixels before assembling<br />
the composite image. Figure 1 shows<br />
examples of DAPI stained nuclei (A) and<br />
FITC-labeled actin (D) for one etched<br />
titanium platelet as an overview at low<br />
magnification and selected regions at<br />
higher magnification (B, E).<br />
For the quantitative analysis of the<br />
cell coverage of the titanium platelets<br />
the images were opened with ImageJ. By<br />
choosing an adequate threshold value<br />
cytoskeletal elements stained by the<br />
FITC conjugated phalloidin and DAPI<br />
stained cell nuclei were discriminated<br />
from the surface of the titanium platelets<br />
not covered by nuclei or cytoplasm of<br />
the fibroblasts (Figure 1C, F). Thresholds<br />
were determined empirically and set to a<br />
gray level value of 200 for DAPI stained<br />
nuclei and 1000 for FITC labeled actin<br />
and these settings were used for the<br />
analysis of all composite images. For<br />
each titanium platelet the number of<br />
pixels with a gray level above threshold<br />
was determined. Using an adequate<br />
calibration the area of the platelet<br />
covered by supra-threshold pixels was<br />
calculated. This area was then expressed<br />
as percentage of the total platelet surface<br />
area that was used for subsequent<br />
comparisons. In addition, the mean gray<br />
level of the pixels with gray levels above<br />
threshold was determined as a measure<br />
of staining intensity. The software SPSS<br />
24 TITANIUMTODAY<br />
for Windows PASW Statistics 17.0.2 was<br />
used for the statistical analysis.<br />
Scanning Electron Microscopy (SEM)<br />
8 titanium platelets (4 etched vs. 4<br />
unetched) were examined by Scanning<br />
Electron Microscopy (Cambridge<br />
Stereoscan 420; Co. Carl Zeiss NTS<br />
GmbH, Oberkochen, Germany) without<br />
previous cell cultivation. The platelets<br />
were mounted on SEM-stubs using<br />
adhesive Conductive-Tabs (Fa. BALTIC<br />
Präparation, Koppelheck 34b, 24359<br />
Niesgrau, Germany) and then examined<br />
under vacuum with an acceleration<br />
voltage of 10 kV. Digital pictures of every<br />
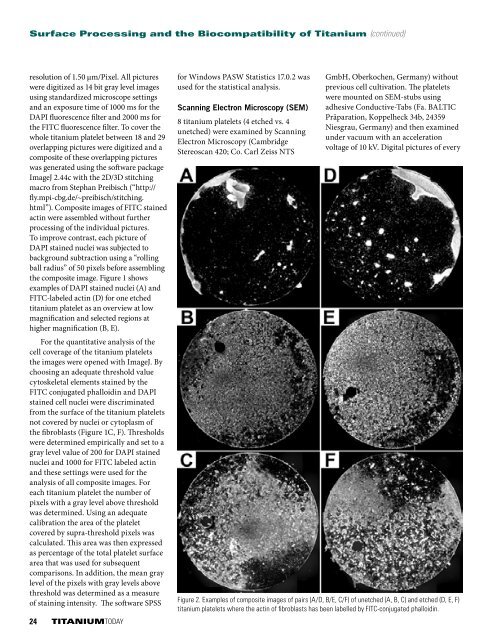
Figure 2. Examples of composite images of pairs (A/D, B/E, C/F) of unetched (A, B, C) and etched (D, E, F)<br />
titanium platelets where the actin of fibroblasts has been labelled by FITC-conjugated phalloidin.