100% Positive Material Identification
23mhiW2
23mhiW2

You also want an ePaper? Increase the reach of your titles
YUMPU automatically turns print PDFs into web optimized ePapers that Google loves.
Surface Processing and the Biocompatibility of Titanium (continued)<br />
probe were taken with a magnification<br />
of up to 1000´, displayed and stored<br />
with SCAN, Digital Image Processing<br />
System 2.1 (Co. point electronic GmbH,<br />
Ackerweg 104, 06103 Halle, Germany).<br />
RESULTS<br />
Qualitative Analysis of Fibroblasts<br />
Growth<br />
First, we compared the fluorescence<br />
microscopic images of the fibroblasts<br />
grown on etched and unetched<br />
titanium platelets qualitatively by visual<br />
inspection. Growth of fibroblasts was<br />
present on all etched and unetched<br />
titanium platelets although the<br />
proportion of the platelet surface covered<br />
by fibroblasts varied substantially<br />
between experiments (Figure 2).<br />
The pattern for the distribution of<br />
FITC-labeled actin and DAPI stained<br />
nuclei of the fibroblasts grown on the<br />
platelets was similar when viewed at low<br />
magnification (compare Figure1A and D).<br />
Differences due to the fact that the nucleus<br />
is a cell organelle within the cytoplasm<br />
became obvious at higher magnifications<br />
(compare Figure 1B and E).<br />
The examples illustrated in Figure<br />
2 demonstrate that a qualitative visual<br />
comparison was not sufficient to<br />
clearly identify an obvious difference<br />
of fibroblast growth on the unetched<br />
and etched platelets. Thus a quantitative<br />
image analysis approach was used in our<br />
search for a potential effect of platelet<br />
conditioning on cultured fibroblasts.<br />
Quantitative Analysis of Platelet<br />
Surface Covered by Cytoplasm<br />
and Nuclei<br />
One measure to compare fibroblasts<br />
grown on unetched and etched titanium<br />
platelets is the proportion of the platelet<br />
surface covered by cytoplasm and<br />
nuclei that is listed in Table 1 for the<br />
different experiments and experimental<br />
conditions.<br />
The quantitative analysis presented<br />
in Table 1 confirms a considerable<br />
degree of variation between the different<br />
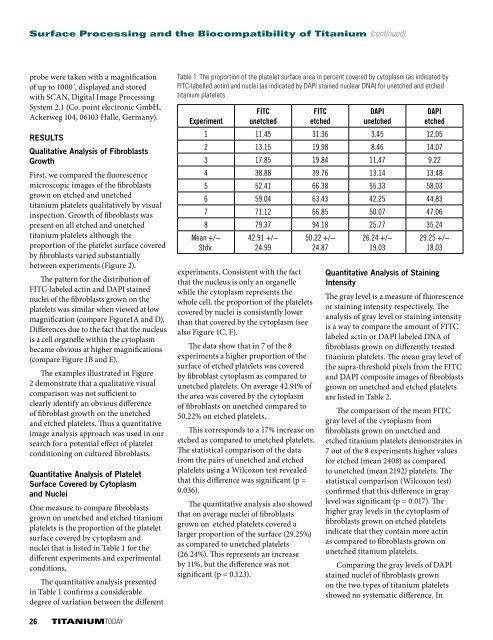
Table 1. The proportion of the platelet surface area in percent covered by cytoplasm (as indicated by<br />
FITC-labelled actin) and nuclei (as indicated by DAPI stained nuclear DNA) for unetched and etched<br />
titanium platelets.<br />
Experiment<br />
FITC<br />
unetched<br />
FITC<br />
etched<br />
DAPI<br />
unetched<br />
DAPI<br />
etched<br />
1 11.45 31.36 3.45 12.05<br />
2 13.15 19.98 8.46 14.07<br />
3 17.85 19.84 11.47 9.22<br />
4 38.88 39.76 13.14 13.48<br />
5 52.41 66.38 55.33 58.03<br />
6 59.04 63.43 42.25 44.83<br />
7 71.12 66.85 50.07 47.06<br />
8 79.37 94.18 25.77 35.24<br />
Mean +/−<br />
Stdv.<br />
42.91 +/−<br />
24.99<br />
experiments. Consistent with the fact<br />
that the nucleus is only an organelle<br />
while the cytoplasm represents the<br />
whole cell, the proportion of the platelets<br />
covered by nuclei is consistently lower<br />
than that covered by the cytoplasm (see<br />
also Figure 1C, F).<br />
The data show that in 7 of the 8<br />
experiments a higher proportion of the<br />
surface of etched platelets was covered<br />
by fibroblast cytoplasm as compared to<br />
unetched platelets. On average 42.91% of<br />
the area was covered by the cytoplasm<br />
of fibroblasts on unetched compared to<br />
50.22% on etched platelets.<br />
This corresponds to a 17% increase on<br />
etched as compared to unetched platelets.<br />
The statistical comparison of the data<br />
from the pairs of unetched and etched<br />
platelets using a Wilcoxon test revealed<br />
that this difference was significant (p =<br />
0.036).<br />
The quantitative analysis also showed<br />
that on average nuclei of fibroblasts<br />
grown on etched platelets covered a<br />
larger proportion of the surface (29.25%)<br />
as compared to unetched platelets<br />
(26.24%). This represents an increase<br />
by 11%, but the difference was not<br />
significant (p = 0.123).<br />
50.22 +/−<br />
24.87<br />
26.24 +/−<br />
19.03<br />
29.25 +/−<br />
18.03<br />
Quantitative Analysis of Staining<br />
Intensity<br />
The gray level is a measure of fluorescence<br />
or staining intensity respectively. The<br />
analysis of gray level or staining intensity<br />
is a way to compare the amount of FITC<br />
labeled actin or DAPI labeled DNA of<br />
fibroblasts grown on differently treated<br />
titanium platelets. The mean gray level of<br />
the supra-threshold pixels from the FITC<br />
and DAPI composite images of fibroblasts<br />
grown on unetched and etched platelets<br />
are listed in Table 2.<br />
The comparison of the mean FITC<br />
gray level of the cytoplasm from<br />
fibroblasts grown on unetched and<br />
etched titanium platelets demonstrates in<br />
7 out of the 8 experiments higher values<br />
for etched (mean 2408) as compared<br />
to unetched (mean 2192) platelets. The<br />
statistical comparison (Wilcoxon test)<br />
confirmed that this difference in gray<br />
level was significant (p = 0.017). The<br />
higher gray levels in the cytoplasm of<br />
fibroblasts grown on etched platelets<br />
indicate that they contain more actin<br />
as compared to fibroblasts grown on<br />
unetched titanium platelets.<br />
Comparing the gray levels of DAPI<br />
stained nuclei of fibroblasts grown<br />
on the two types of titanium platelets<br />
showed no systematic difference. In<br />
26 TITANIUMTODAY