GEOmedia_3_2016 special issue for INTERGEO

You also want an ePaper? Increase the reach of your titles
YUMPU automatically turns print PDFs into web optimized ePapers that Google loves.
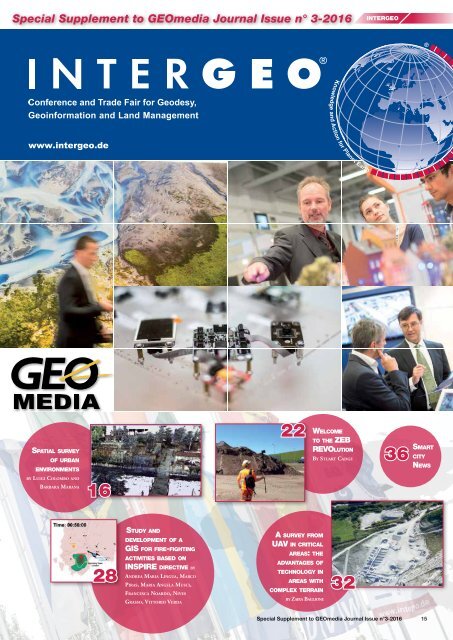
Special Supplement to <strong>GEOmedia</strong> Journal Issue n° 3-<strong>2016</strong><br />
<strong>INTERGEO</strong><br />
www.intergeo.de<br />
SPATIAL SURVEY<br />
OF URBAN<br />
ENVIRONMENTS<br />
22<br />
WELCOME<br />
TO THE ZEB<br />
REVOLUTION<br />
BY STUART CADGE<br />
36<br />
SMART<br />
CITY<br />
NEWS<br />
BY LUIGI COLOMBO AND<br />
BARBARA MARANA<br />
16<br />
28<br />
STUDY AND<br />
DEVELOPMENT OF A<br />
GIS FOR FIRE-FIGHTING<br />
ACTIVITIES BASED ON<br />
INSPIRE DIRECTIVE BY<br />
ANDREA MARIA LINGUA, MARCO<br />
PIRAS, MARIA ANGELA MUSCI,<br />
FRANCESCA NOARDO, NIVES<br />
GRASSO, VITTORIO VERDA<br />
A SURVEY FROM<br />
UAV IN CRITICAL<br />
AREAS: THE<br />
ADVANTAGES OF<br />
TECHNOLOGY IN<br />
AREAS WITH<br />
COMPLEX TERRAIN<br />
BY ZAIRA BAGLIONE<br />
32<br />
Special Supplement to <strong>GEOmedia</strong> Journal Issue n°3-<strong>2016</strong> 15
<strong>INTERGEO</strong><br />
SPATIAL SURVEY OF URBAN ENVIRONMENTS<br />
by Luigi Colombo and Barbara Marana<br />
The paper deals some experimental<br />
benchmarks regarding urban environment<br />
modelling. The employed techniques,<br />
which automatically collected point clouds<br />
and created the DSM, are terrestrial laser<br />
scanning, with a direct GNSSRTK<br />
geo-referencing, and UAS imagery.<br />
Fig. 3 - A perspective view of S. Pellegrino Terme inside the point model.<br />
The technological innovation<br />
in survey<br />
techniques has nowadays<br />
led to the development of<br />
automated systems, with combined<br />
multi-functional sensors<br />
including laser scanning, GNSS<br />
receivers and imaging. These<br />
devices can per<strong>for</strong>m on field<br />
metric operations, ranging from<br />
spatial modelling, geo-referencing<br />
of objects in an assigned<br />
coordinate system, fast spatial<br />
reconstructions of interiors or<br />
exteriors and roofs, with the<br />
Fig. 1 - Nadir and oblique images.<br />
related thematic in<strong>for</strong>mation<br />
(colour, materials, decay).<br />
The automatic sensors allow<br />
to mainly collect point clouds,<br />
from the ground, from road<br />
vehicles or small remotely piloted<br />
aircraft (Unmanned Arial<br />
Systems). This redundant mass<br />
of data simplifies the survey<br />
process, increasing productivity<br />
<strong>for</strong> 3D modelling and derived<br />
sub-products (vector-raster),<br />
such as perspective views, elevations,<br />
orthophotos, horizontal<br />
and vertical sections, thematic<br />
maps, etc.<br />
Present technologies and<br />
techniques<br />
Point clouds are today the first<br />
source of spatial in<strong>for</strong>mation<br />
(also texturized with colours or<br />
reflected energy). The clouds<br />
are generated by automated<br />
survey techniques, without<br />
contact, and represent the basis<br />
<strong>for</strong> creating the so-called Digital<br />
Surface Models.<br />
Terrestrial and air-transported<br />
laser scanning has been till now<br />
the main way to generate online<br />
point clouds; more recently,<br />
the research in Computer<br />
Vision has deeply trans<strong>for</strong>med<br />
imaging survey, allowing the<br />
off-line extraction of point<br />
clouds from image blocks. One<br />
speaks in this case of Dense<br />
Image Matching, referring to<br />
the software procedures which<br />
guarantee this technologic enhancement.<br />
It is known that the point cloud<br />
collection does not occur in a<br />
deterministic <strong>for</strong>m, as manual<br />
surveys (the meaningful points,<br />
only), but in a stochastic way,<br />
with the surveyed points which<br />
become the nodes of a sampling<br />
grid superimposed over the objects.<br />
The grid step depends on selected<br />
spatial resolution, measurement<br />
distance, laser beam<br />
impact (normality, obliquity)<br />
and morphologic surface irregularities.<br />
The transition from the grid<br />
nodes to the interest points is<br />
then per<strong>for</strong>med by applying local<br />
interpolation processes.<br />
Much is known and has been<br />
written these years about scanning<br />
systems and associated<br />
16 Special Supplement to <strong>GEOmedia</strong> Journal Issue n. 3-<strong>2016</strong>
<strong>INTERGEO</strong><br />
Fig. 2 - Direct geo-referencing <strong>for</strong> scanning survey.<br />
procedures, much less, perhaps,<br />
about the bi-centennial imaging<br />
survey. This technique was<br />
indeed overcome at the end<br />
of the previous century by the<br />
advent and fast development of<br />
laser scanning and only recently<br />
it is coming back thanks to<br />
Computer Vision support and<br />
to remotely piloted aircrafts.<br />
However, this cannot be considered<br />
a return to the past but<br />
rather a “back to the future” (as<br />
written by someone), because<br />
the technological scenario has<br />
now significantly changed (processing<br />
algorithms and so on).<br />
Laser technology nevertheless<br />
provides the relevant advantage<br />
(thanks to the measured stationpoint<br />
distance) that just one<br />
single ray has to be reflected<br />
from an object point <strong>for</strong> its 3D<br />
determination; on the contrary,<br />
imagery survey needs at least<br />
two homologous reflected rays<br />
(from different sensor locations)<br />
<strong>for</strong> each object point and some<br />
measured in<strong>for</strong>mation on the<br />
point model, as well.<br />
Additionally, if problems arise<br />
in laser scanning applications,<br />
regarding reflective, transparent<br />
and translucent surfaces (metals,<br />
marble, paints, glass, etc.),<br />
also <strong>for</strong> imagery approach the<br />
surveyed objects must present a<br />
meaningful geometry and thematic<br />
characters, such as nonuni<strong>for</strong>m<br />
or not smooth and<br />
monochrome surfaces and few<br />
shadows.<br />
These conditions are necessary<br />
to allow automatic recognition<br />
of homologous points among<br />
corresponding frames: the<br />
process is per<strong>for</strong>med by means<br />
of digital image correlation algorithms,<br />
with the support of<br />
epipolar geometry to speed up<br />
the search.<br />
The acquisition phase registers a<br />
block of photos, longitudinally<br />
and transversally overlapped according<br />
to the type of selected<br />
survey (2D or 3D) (fig. 1):<br />
aerial nadir or oblique images<br />
are collected through horizontal<br />
strips (ground survey) together<br />
with normal or oblique shootings<br />
belonging to vertical strips<br />
(façade survey).<br />
The aerial carrier brings survey<br />
sensors and navigational devices<br />
(GNSS+INS) <strong>for</strong> recording realtime<br />
position and attitude of<br />
the photo-camera: this enables<br />
both autonomous flights, via<br />
pre-defined way-points, and a<br />
geo-referencing process based on<br />
GNSS-RTK or PPK techniques<br />
(the so-called Direct<br />
Photogrammetry).<br />
Remotely piloted small<br />
aircrafts (UAS) are vertical<br />
take-off and landing carriers,<br />
with hovering functions (the<br />
so-called multi-rotorcrafts), or<br />
fixed-wing aircrafts. All systems<br />
are equipped with a stabilized<br />
plat<strong>for</strong>m to overcome spatial<br />
rotations produced by flight,<br />
air turbulence or wind, and can<br />
carry a payload, that is the sensors<br />
<strong>for</strong> survey.<br />
The UASs allow lower flightheights,<br />
compared with<br />
manned aircrafts; so, a larger<br />
image scale is collected, with<br />
the same value of camera focal<br />
length, and higher levels of detail<br />
and height accuracy.<br />
Certainly, the lower flight<br />
height increases the <strong>for</strong>ward<br />
motion effects on the image, resulting<br />
in blurring phenomena;<br />
it is possible to limit this problem<br />
both by reducing the cruise<br />
speed and well combining<br />
stops, shutter time and sensitivity<br />
(ISO) of the digital sensor.<br />
So, the motion blur can be kept<br />
within the pixel size of the photo<br />
and the relative object settlement<br />
inside the GSD parameter<br />
(Ground Sampling Distance).<br />
Some experiences regarding<br />
multi-sensor survey <strong>for</strong> territory<br />
documentation were recently<br />
per<strong>for</strong>med at the University<br />
of Bergamo by the Geomatics<br />
group: two applications of them<br />
are described below.<br />
Fig. 4 - A 3D view of the point model <strong>for</strong> the ancient bridge.<br />
Fig. 5 - 3D model: a bank of the Brembo river with hotels and restaurants.<br />
Special Supplement to <strong>GEOmedia</strong> Journal Issue n°3-<strong>2016</strong> 17
<strong>INTERGEO</strong><br />
The first experience:<br />
the multi-scale survey<br />
of S. Pellegrino Terme<br />
This application regards the<br />
multi-scale survey with terrestrial<br />
laser scanning realized over<br />
the urban land of S. Pellegrino<br />
Terme, a small ancient town<br />
close to Bergamo (northern<br />
Italy).<br />
Advanced laser-scanning technologies<br />
were used, with a<br />
remarkable attention to the<br />
needed level of detail and with<br />
a careful look at buildings, their<br />
decorations and history. The<br />
reconstructed model was also<br />
utilized to create a virtual walkthrough<br />
<strong>for</strong> land investigation.<br />
The per<strong>for</strong>med survey has<br />
pointed out the original development<br />
of this settlement, designed<br />
<strong>for</strong> leisure and wellness,<br />
which was followed early by<br />
a gradual decadence that only<br />
new ideas and a renewed love<br />
<strong>for</strong> the site could overcome.<br />
The standards <strong>for</strong> urban model<br />
construction and management<br />
(city modelling) were proposed<br />
by the Open Geospatial<br />
Consortium (OGC) with the<br />
CityGML: these models are<br />
typically multi-scale 3D applications,<br />
ranging from landscape<br />
simulation to urban planning,<br />
from managing calamities to<br />
safety monitoring, etc.<br />
A modelling process requires<br />
the selection of geometric entities<br />
according to the chosen<br />
level of detail (LoD) and the<br />
attribution of textures <strong>for</strong> augmenting<br />
realism. This way,<br />
the survey approach <strong>for</strong> S.<br />
Pellegrino Terme documentation<br />
was established, together<br />
with the set of data to collect.<br />
It is known that laser scanning<br />
and imaging provide a dense<br />
object-point cloud, which can<br />
be geo-referenced in an assigned<br />
coordinate system. The geo-referencing<br />
is per<strong>for</strong>med either indirectly,<br />
through control points<br />
Fig. 6 - Orthographic elevations of the Spa-buildings, extracted from the point model.<br />
(pre-marked and measured on<br />
the object) and matching procedures<br />
based on natural features,<br />
or directly using satellite positioning<br />
and orientation devices.<br />
The localization quality is enhanced<br />
through differential<br />
positioning techniques via<br />
Internet corrections (code or<br />
phase), transmitted from a<br />
GNSS reference networks: a<br />
few centimetre accuracy (at<br />
95% likelihood) is guaranteed,<br />
either interactively via a RTK<br />
approach or in Post-Processing<br />
(PPK). In the described application,<br />
the GNSS reference<br />
network (NetGeo), by Topcon<br />
Positioning, was used.<br />
The direct geo-referencing,<br />
without control points and an<br />
alignment phase, is particularly<br />
convenient in applications<br />
regarding large areas (requiring<br />
several scans) when a level<br />
of detail equal or lower than<br />
LoD2-3 (likewise the scale<br />
1:200 or smaller) is required.<br />
Obviously, where the satellite<br />
signal is not guaranteed, due to<br />
urban obstructions, indirect or<br />
mixed geo-referencing have to<br />
be applied.<br />
Anyway, it is useful to select<br />
some check points (CP), among<br />
the control points (GCP), to<br />
assess the final accuracy of the<br />
process.<br />
Figure 2 shows the adopted<br />
scheme <strong>for</strong> capturing direct georeferenced<br />
object points: a laser<br />
scanner was used (Faro) and<br />
two satellite receivers (Topcon),<br />
fitted with a bracket respectively<br />
over the scanner and on an orientation<br />
point; both the receiv-<br />
18 Special Supplement to <strong>GEOmedia</strong> Journal Issue n. 3-<strong>2016</strong><br />
Fig. 7 - A view of the monastic complex in Albino
<strong>INTERGEO</strong><br />
ers, which operated in staticrapid<br />
mode, were connected via<br />
Internet to NetGeo <strong>for</strong> a fine<br />
RTK positioning in the Italian<br />
reference system (ETRF 2000).<br />
The set of direct geo-referenced<br />
scanning stations also provided<br />
a pseudo GNSS network, able<br />
to act as a geodetic support.<br />
The collected point clouds were<br />
altogether 200, with an average<br />
spatial resolution of 100 mm in<br />
the useful range (10÷350) m;<br />
the computer storage has been<br />
globally around 26 GB.<br />
S. Pellegrino Terme, a small<br />
tourist settlement today, was<br />
very fashionable last century<br />
in the world of entrepreneurial<br />
bourgeoisie. The town is located<br />
along the narrow Brembo<br />
valley (north of the city of<br />
Bergamo): famous <strong>for</strong> the healing<br />
waters, it stands out in the<br />
local landscape with the undisputed<br />
charm of its architectures<br />
and the elegance of the urban<br />
environment.<br />
Among the artistic treasures,<br />
it must be remembered the<br />
municipal Club-House (1904-<br />
1906), with two towers reminiscent<br />
of the famous one in<br />
Monte Carlo (Principality of<br />
Monaco), and the impressive<br />
Grand Hotel (1904), along the<br />
Brembo river, with the large<br />
front full of decorations.<br />
The Grand Hotel is connected<br />
to the Club-House and the Spa<br />
buildings, located on the right<br />
bank of the river, through the<br />
bridge “Principe Umberto I”.<br />
All these structures were realized<br />
at the beginning of the<br />
nineteenth century in the<br />
years of Belle Époque and Art<br />
Nouveau.<br />
The terrestrial scanning survey<br />
was per<strong>for</strong>med in a multi-level<br />
detail, ranging from OGC-<br />
LoD2 and OGC-LoD4, and<br />
corresponding to the scales<br />
from 1:500 to 1:100.<br />
A Faro laser scanner (Focus<br />
X330) was utilized, with a builtin<br />
photo-camera; this scanner,<br />
characterized by a long range<br />
(around 350 m), is particularly<br />
effective <strong>for</strong> 3D survey of large<br />
territorial spaces because it allows<br />
a meaningful reduction<br />
of the instrumental stations<br />
needed to capture in<strong>for</strong>mation<br />
(see figures 3, 4, 5, 6).<br />
Good results were generally<br />
obtained, despite some deficiencies<br />
in the building-roof<br />
documentation, thanks to the<br />
favorable hilly morphology and<br />
the large range provided by the<br />
scanning device.<br />
The roof knowledge could be<br />
better realized through an additional<br />
survey from above, using<br />
UAS techniques.<br />
The other experience:<br />
the UAS survey of the<br />
Dehonian complex<br />
The religious complex of<br />
Dehonian fathers, is located in<br />
Albino, a small town in the valley<br />
of Serio, the river flowing<br />
down from the mountains surrounding<br />
Bergamo.<br />
This Apostolic school was<br />
built in 1910; during the years<br />
of World War II it became a<br />
kind of big ark hosting people<br />
evacuated from their homes<br />
and moved to Albino, which<br />
was considered safer from the<br />
bombing risk.<br />
In 1944 a part of the complex<br />
was occupied by the Italian military,<br />
who remained there until<br />
early 1945; during the war, the<br />
little town was bombed but the<br />
Apostolic school was luckily<br />
spared.<br />
In the following years, until<br />
1991, the structure served as<br />
Diocesan Seminary; when this<br />
activity ceased, the complex of<br />
buildings was renovated to create<br />
a meeting point <strong>for</strong> spirituality<br />
(fig. 7), still active.<br />
The imaging survey (using a<br />
hexa-copter) aimed to provide a<br />
Fig. 8a – The flight planning <strong>for</strong> the nadir image coverage.<br />
Fig. 8b – Vertical strips with oblique images.<br />
spatial model of the built area,<br />
including roofs, <strong>for</strong> documentation<br />
and maintenance purposes.<br />
The model, with a level of<br />
detail equal to 1:200 scale, was<br />
per<strong>for</strong>med by:<br />
- a nadir image coverage with<br />
horizontal (parallel) strips (fig.<br />
8a) from heights less than 50<br />
m, taken by a Sony photocamera<br />
with a 14.2 MP CMOS<br />
sensor (fixed focal length of 16<br />
mm); the image overlaps were<br />
between 80% and 60% and the<br />
carrier speed around 5 m/s.<br />
- some up and down vertical<br />
strips over the façades, with<br />
oblique images taken at a surface<br />
distance around 10 m (fig.<br />
8b).<br />
It is known that an image-based<br />
survey can be per<strong>for</strong>med using<br />
algorithms, techniques and<br />
software ranging from those of<br />
Special Supplement to <strong>GEOmedia</strong> Journal Issue n°3-<strong>2016</strong> 19
<strong>INTERGEO</strong><br />
Fig. 9 - Software <strong>for</strong> imaging.<br />
classical Photogrammetry to<br />
the modern ones of Computer<br />
Vision; some well-known packages<br />
<strong>for</strong> imaging are shown in<br />
figure 9.<br />
The collected nadir and oblique<br />
images <strong>for</strong> the religious complex<br />
(fig. 10), around 400 photos,<br />
were used to generate a 3D<br />
model through a dense image<br />
matching, per<strong>for</strong>med inside the<br />
Swiss-made Pix4D Mapper, a<br />
software of Computer Vision.<br />
About thirty Ground Control<br />
Points, <strong>for</strong> block adjustment<br />
and geo-referencing (Italian<br />
Reference System - ETRF 2000),<br />
Fig. 10 - The set of collected nadir and horizontal images.<br />
were targeted over some selected<br />
details (on ground and<br />
roofs), measured by direct<br />
topographic methods (accuracy<br />
equal to a few centimetres) and<br />
then observed over the images.<br />
Figure 11 points out the georeferenced<br />
orthomosaic per<strong>for</strong>med<br />
from the set of photos<br />
and regarding the main cloister;<br />
figure 12 shows the correspondent<br />
3D reconstruction through<br />
a perspective view with phototextures.<br />
It is interesting to observe that<br />
the imaging model has resulted<br />
a bit more smoothed in comparison<br />
with those per<strong>for</strong>med<br />
through a laser scanning approach.<br />
Final remarks<br />
The described experiences have<br />
highlighted the great potentiality<br />
that laser scanning and<br />
UAS imagery can offer <strong>for</strong> a<br />
Fig. 11 - A geo-referenced orthomosaic <strong>for</strong> the main cloister.<br />
multi-scale analysis of urban<br />
land. This is the result of the<br />
meaningful development now<br />
achieved in the acquisition<br />
phase, the deep ease allowed by<br />
automation and the increased<br />
reliability. The software has<br />
once more had a central role <strong>for</strong><br />
an effective point cloud management<br />
and raster-vector production.<br />
The support of GNSS-<br />
RTK technology has been<br />
useful <strong>for</strong> cloud connection<br />
(direct and automatic); besides,<br />
GNSS and INS units represents<br />
a fundamental basis <strong>for</strong> autonomous<br />
aerial navigation and<br />
positioning. Surely, the integration<br />
between laser scanning and<br />
UAS imagery will become more<br />
and more interesting, to allow a<br />
complete photo-realistic model<br />
of urban environments; anyway,<br />
some security aspects have to be<br />
still improved in relation to aircraft<br />
standards and flights.<br />
Acknowledgements<br />
The authors wish to thank the<br />
students Lorenzo Filippini,<br />
Riccardo Begnis and Daniela<br />
Piantoni, who developed their<br />
master theses in Building<br />
Engineering, and Eng. Giorgio<br />
Ubbiali of DMStrumenti <strong>for</strong><br />
the technological support in the<br />
measurement campaign.<br />
Fig. 12 - A 3D view regarding the reconstructed photorealistic model of the complex.<br />
20 Special Supplement to <strong>GEOmedia</strong> Journal Issue n. 3-<strong>2016</strong>
<strong>INTERGEO</strong><br />
REFERENCES<br />
B. Bhandari, U. Oli, N. Panta, U. Pudasaini (2015) -<br />
Generation of high resolution DSM using UAV images - FIG<br />
Working Week 2015 - Sofia - May 2015<br />
L. Colombo, B. Marana (2015) - Terrestrial multi-sensor survey<br />
<strong>for</strong> urban modelling - Geoin<strong>for</strong>matics, 3-2015<br />
H. Hirschmueller (2011) - Semi-Global Matching -<br />
Motivation, developments and applications - Proceedings of<br />
Photogrammetric Week 2011, Stuttgart - Wichmann<br />
J.N. Lee, K.C. Kwak (2014) - A trends analysis of image processing<br />
in Unmanned Aerial Vehicle International Journal of<br />
Computer, In<strong>for</strong>mation Science and Engineering, 8(2)<br />
M. Naumann, G. Grenzdoerffer (<strong>2016</strong>) - Reconstructing a<br />
church in 3D - GIM International, 2-<strong>2016</strong><br />
R. Pacey, P. Fricker (2005) - Forward Motion Compensation<br />
(FMC) - Photogrammetric Engineering & Remote Sensing,<br />
November 2005<br />
R. Szeliski (2011) - Computer Vision: Algorithms and applications<br />
- Springer - New York<br />
ABSTRACT<br />
The paper deals some experimental benchmarks regarding urban environment<br />
modelling. The first application has been per<strong>for</strong>med over the small<br />
thermal settlement of S. Pellegrino Terme, famous in northern Italy both<br />
<strong>for</strong> the healing waters and <strong>for</strong> its rich Art Noveau architectural decorations;<br />
the second test is the documentation of the religious complex of<br />
Dehonians in Albino, a little town close to Bergamo (Italy).<br />
The employed techniques, which automatically collected point clouds<br />
and created the DSM, are terrestrial laser scanning, with a direct GNSS-<br />
RTK geo-referencing, and UAS imagery.<br />
AUTHOR<br />
Luigi Colombo<br />
Luigi.colombo@unibg.it<br />
Barbara Marana<br />
Barbara.marana@unibg.it<br />
University of Bergamo<br />
DISA - Geomatics Group<br />
Dalmine (Italy)<br />
KEYWORDS<br />
Land documentation; point-cloud analysis; laser scanning;<br />
UAS imagery<br />
Special Supplement to <strong>GEOmedia</strong> Journal Issue n°3-<strong>2016</strong> 21
<strong>INTERGEO</strong><br />
Welcome to the ZEB REVOlution<br />
by Stuart Cadge<br />
In this article we will introduce<br />
the ZEB-REVO, and the attributes<br />
that make this a unique piece<br />
of surveying hardware. We will<br />
discuss how the ZEB-REVO is<br />
shaking up the surveying market,<br />
Fig. 1 - The ZEB-REVO in action – handheld, pole-mounted, backpack-mounted – a<br />
truly versatile tool.<br />
and will look at a number of<br />
industry applications in which the<br />
ZEB-REVO is making a difference.<br />
The surveying industry<br />
has witnessed rapid<br />
changes in the last<br />
few years - the increased use<br />
of mobile surveying devices<br />
and the utilisation of LiDAR<br />
technology (Light Detection<br />
And Ranging) to produce 3-dimensional<br />
point clouds of the<br />
survey subject are two such examples.<br />
Another major shift is<br />
the mapping of indoor spaces,<br />
utilising technology that does<br />
not rely on GPS.<br />
Leading the <strong>for</strong>e in all of these<br />
technologies is GeoSLAM,<br />
a young, vibrant technology<br />
company based in the UK.<br />
GeoSLAM <strong>special</strong>ises in the<br />
manufacture and supply of<br />
indoor, handheld mobile surveying<br />
units; the ZEB1 and the<br />
new ZEB-REVO, launched in<br />
March <strong>2016</strong>.<br />
Strong Beginnings<br />
GeoSLAM was founded in<br />
2012 as a joint venture between<br />
CSIRO (Australia’s National<br />
Science Agency and the inventors<br />
of WiFi) and 3D Laser<br />
Mapping (a leading global provider<br />
of 3D LIDAR solutions).<br />
Coming from such strong pedigree<br />
has allowed GeoSLAM to<br />
grow rapidly in both range and<br />
scope, currently incorporating a<br />
global distribution network of<br />
35 agents across 6 continents.<br />
GeoSLAM launched their first<br />
mobile scanner, the ZEB1, in<br />
Q4 of 2013. With its springmounted<br />
head and nodding<br />
movement, the ZEB1 quickly<br />
Fig. 2 - Comparison of ZEB1 data (left) and ZEB-REVO data (right) Image courtesy of Opti-cal<br />
Survey Equipment.<br />
gained notoriety and popularity.<br />
Early adopters were amazed<br />
by the speed of scanning, the<br />
ease of use and the quality<br />
of the results. Data processing<br />
was also a simple process<br />
– customers simply ‘drag and<br />
drop’ their raw datasets onto<br />
an online Uploader, in order to<br />
register and process their scan.<br />
In a matter of minutes, fullyregistered<br />
3D point clouds were<br />
obtained.<br />
However, GeoSLAM did not<br />
rest on their laurels. The technology<br />
industry moves quickly,<br />
and GeoSLAM knew that a<br />
second, more sophisticated<br />
solution was required. ZEB1<br />
customers spoke of their desire<br />
<strong>for</strong> a truly-mobile scanner –<br />
one that wasn’t just handheld.<br />
They also wanted a fuller,<br />
more even point cloud that the<br />
40Hz ZEB1 could produce.<br />
When the customers spoke,<br />
GeoSLAM listened.<br />
The REVOlution Begins<br />
In March <strong>2016</strong>, the ZEB-<br />
REVO was launched. Featuring<br />
an in-built motor to create<br />
360 o rotation, the REVO can,<br />
like the ZEB1, be handheld.<br />
However, it can also be mounted<br />
onto an extending pole,<br />
fastened to a backpack, secured<br />
to a trolley or vehicle, even<br />
strapped to a UAV <strong>for</strong> aerial<br />
surveys.<br />
22 Special Supplement to <strong>GEOmedia</strong> Journal Issue n. 3-<strong>2016</strong>
<strong>INTERGEO</strong><br />
Fig. 3 - Building surveys (such as this family-sized home) are completed in minutes, not hours, with the ZEB-REVO.<br />
The autonomous motion of<br />
the motorised scan head opens<br />
up a world of new applications<br />
<strong>for</strong> this clever little scanner.<br />
Little being the operative word;<br />
weighing just over 4kg (including<br />
the backpack) and with the<br />
scanner head measuring 9 x 11<br />
x 29cm, this is a surveying tool<br />
that is truly mobile.<br />
It’s not just the outside that<br />
has evolved – inside the scanner<br />
head is a powerful yet safe<br />
(Class 1 Eye safe) 100Hz laser –<br />
making an impressive 100 rotations/second.<br />
The unit collects<br />
the same number of points per<br />
second as the ZEB1 – 43,200.<br />
So what’s the advantage of this<br />
faster speed?<br />
The increased scan speed (over<br />
2.5 times faster than the ZEB1)<br />
means that the collected data<br />
points are spread out more<br />
evenly over a greater number of<br />
scan lines - giving the appearance<br />
of smoother, cleaner and<br />
less noisy datasets. More importantly,<br />
this even distribution of<br />
points allows the world-beating<br />
SLAM algorithm to work better.<br />
The SLAM algorithm works<br />
by dividing the scanned surface<br />
into sectors, and identifying<br />
points within each sector. If a<br />
sector is devoid of points, then<br />
it cannot be included in the<br />
algorithm. So, by having a more<br />
even distribution of points, the<br />
SLAM algorithm can build a<br />
fuller, more complete point<br />
cloud.<br />
The difference is clear to see.<br />
Compare the two images below<br />
of the same elevation. The view<br />
on the left is ZEB1 data, which<br />
is characterised by a striated,<br />
lined appearance. There are a<br />
few gaps, e<strong>special</strong>ly higher up<br />
the elevation where the scan<br />
lines have hit the elevation at a<br />
more acute angle.<br />
The right hand view is the<br />
same elevation captured with a<br />
ZEB-REVO. The point cloud<br />
is cleaner and the points are<br />
more evenly distributed – creating<br />
a much more ‘complete’<br />
looking point cloud. Not only<br />
does this provide better results,<br />
it also supplies the user with<br />
vitally important confidence in<br />
the kit.<br />
Versatility in Action<br />
The upshot of these technological<br />
advances is the sheer number<br />
of new applications and<br />
industries that are now open to<br />
scanning with the ZEB-REVO.<br />
Whether it is simply improving<br />
an existing workflow of the<br />
ZEB1 (i.e. stockpile surveys<br />
and building scans) or opening<br />
up brand new uses (i.e. manhole<br />
and suspended ceilings,<br />
utility trenches) versatility is the<br />
word <strong>for</strong> the ZEB-REVO. A<br />
number of these new and improved<br />
applications are featured<br />
below.<br />
Building Surveys<br />
Building surveys have long been<br />
the ‘bread and butter’ work of<br />
the ZEB1 – the simplicity, ease<br />
of use, highly mobile nature<br />
of the unit lends it perfectly to<br />
multi-level, indoor structures.<br />
The ZEB-REVO has simply<br />
improved and built upon this<br />
success.<br />
The increased scan speed creates<br />
a fuller, more complete point<br />
cloud, reducing the number of<br />
areas with low coverage. The<br />
ability to rapidly unscrew the<br />
handle and attach an extending<br />
pole allows the user to reach<br />
into spaces that may not otherwise<br />
have been available – into<br />
loft spaces, suspended ceilings,<br />
even to ‘poke’ the unit out of<br />
windows in order to obtain<br />
overlaps with the building exterior.<br />
Underground Mapping<br />
Another staple of the ZEB1,<br />
underground mapping includes<br />
both mine and cave surveys.<br />
Similarly to buildings, under-<br />
Fig. 4 - The ZEB-RE-<br />
VO in action – handheld,<br />
pole-mounted,<br />
backpack-mounted –<br />
a truly versatile tool.<br />
Special Supplement to <strong>GEOmedia</strong> Journal Issue n°3-<strong>2016</strong> 23
<strong>INTERGEO</strong><br />
ground is the perfect<br />
environment <strong>for</strong> ZEB<br />
systems, being devoid of<br />
GPS, totally enclosed, and<br />
often with many unique features<br />
<strong>for</strong> the SLAM algorithm<br />
to work with. Not only have<br />
ZEB systems been proven to increase<br />
survey quality and detail<br />
(over traditional survey methods),<br />
they have also slashed survey<br />
times by a factor of 3.<br />
A major advantage of the ZEB-<br />
REVO in these environments is<br />
safety – and the ability <strong>for</strong> the<br />
REVO to access areas that human<br />
users cannot. The autonomous<br />
nature of the ZEB-REVO<br />
allows the unit to be attached<br />
to a remote-controlled trolley<br />
system and sent into areas that<br />
are either too small to access,<br />
or that are hazardous to health.<br />
The image shows the ZEB-<br />
REVO head mounted onto the<br />
front of a remote-controlled<br />
trolley in a mine. The datalogger<br />
sits just behind the head<br />
in the body of the trolley. The<br />
trolley was sent into a restricted<br />
area of the mine that was inaccessible<br />
to people, allowed to<br />
scan, and returned to its starting<br />
position.<br />
Stockpiles<br />
Another area of application<br />
where both the ZEB1 and<br />
ZEB-REVO excel. With these<br />
mobile scanning units, stockpiles<br />
of all varieties can be surveyed<br />
in a matter of minutes.<br />
The survey data can then be<br />
easily imported into a variety of<br />
third party software packages,<br />
where volumetric calculations<br />
can be carried out in minutes.<br />
The advantages of the REVO<br />
in this application are complete<br />
coverage and continuous scanning.<br />
A potential pitfall of using<br />
the ZEB1 <strong>for</strong> stockpile scanning<br />
was the chance that areas<br />
would be missed, e<strong>special</strong>ly the<br />
very top of the pile. It is not<br />
advisable to walk on the stockpile<br />
<strong>for</strong> obvious safety reasons.<br />
There<strong>for</strong>e, a pole-mounted<br />
ZEB-REVO can be utilised to<br />
ensure that complete coverage<br />
of the stockpile is obtained,<br />
allowing <strong>for</strong> a complete point<br />
cloud model, and there<strong>for</strong>e, a<br />
more accurate volume calculation.<br />
The second major advantage<br />
is the ability to simply<br />
wall-mount the unit. For many<br />
stockpile applications (and particularly<br />
<strong>for</strong> indoor stockpiles),<br />
continuous analysis of the<br />
stockpile is required. With a remotely<br />
operated, wall-mounted<br />
unit, this is now a reality. It is<br />
simply a case <strong>for</strong> the unit to be<br />
switched on when a survey is<br />
required, and the autonomous<br />
motion will carry out the scan.<br />
The 360 o vertical by 270o horizontal<br />
field of view (i.e. just a<br />
90o blind spot to the rear) ensures<br />
that no parts of the pile<br />
are missed..<br />
Marine<br />
A rather newer application <strong>for</strong><br />
the ZEB systems is in the world<br />
of marine surveying. Anybody<br />
who has been on a marine vessel<br />
will know that space is at a<br />
premium; this is even more so<br />
when it comes to submarine<br />
vessels.<br />
A number of marine authorities<br />
and businesses have a requirement<br />
to accurately but rapidly<br />
survey their stock, either <strong>for</strong><br />
the purposes of creating 2-dimensional<br />
blueprints, or <strong>for</strong> the<br />
creation of 3-dimensional, fully<br />
interactive models.<br />
Both the ZEB1 and the ZEB-<br />
REVO can be rapidly deployed<br />
in a marine environment, and<br />
used to create a 3-dimensional<br />
point cloud of these hugely<br />
complex environments.<br />
Forestry<br />
Thought that ZEB units were<br />
<strong>for</strong> indoor use only? Think<br />
again. The ZEB1 and ZEB-<br />
REVO work best in ‘enclosed’<br />
environments – not necessarily<br />
just indoor ones. A typical <strong>for</strong>est<br />
will naturally be considered<br />
to be an ‘enclosed’ environment<br />
by the unit, as the tree canopy<br />
creates a natural ‘ceiling’.<br />
Coupled with the proliferation<br />
of unique features that a <strong>for</strong>est<br />
holds, and it can be seen that<br />
<strong>for</strong>ests are the perfect environment<br />
<strong>for</strong> ZEB scanners.<br />
Over the summer of <strong>2016</strong>, a<br />
number of different <strong>for</strong>estry<br />
studies are being carried out<br />
using the ZEB-REVO scanner.<br />
The first of these studies, carried<br />
out by the Geography department<br />
of University College<br />
London (UCL), focussed on<br />
measuring small de<strong>for</strong>mations<br />
in the ground topography of a<br />
mechanically-harvested area of<br />
<strong>for</strong>estry.<br />
Fig. 5 - Stockpile scanning is made<br />
simple with the pole-mounted ZEB-REVO.<br />
Fig. 6 - Cross<br />
section through<br />
the engine room<br />
of a marine vessel<br />
captured with<br />
the ZEB-REVO.<br />
24 Special Supplement to <strong>GEOmedia</strong> Journal Issue n. 3-<strong>2016</strong>
<strong>INTERGEO</strong><br />
Fig. 7 - 3D data<br />
of a vehicle<br />
captured with<br />
the ZEB-REVO<br />
in minutes.<br />
The suspicious<br />
package is highlighted<br />
red.<br />
From the data collected, the<br />
team were able to create a cmaccurate<br />
digital elevation model<br />
(DEM) spanning 100s of square<br />
metres. This data is then being<br />
used to measure the outputs of<br />
methane (CH 4<br />
) from these areas<br />
of felled <strong>for</strong>estry.<br />
Another study, conducted in<br />
relation with the University of<br />
Leicester, involves the mapping<br />
of varying <strong>for</strong>estry habitats<br />
across the UK. The aim of this<br />
study is to make comparisons<br />
between different <strong>for</strong>estry habitats<br />
across the UK, and also to<br />
combine the data captured with<br />
the handheld ZEB-REVO with<br />
data captured from above, using<br />
spaceborne-rader and UAVbased<br />
imagery.<br />
On a simpler note, both ZEB<br />
units can be utilised to rapidly<br />
and accurately scan an area of<br />
<strong>for</strong>estry, to obtain the point<br />
cloud data, and to make cuts or<br />
sections in the data at certain<br />
heights. One such important<br />
height is the breast height diameter<br />
(BHD), which is a measurement<br />
taken at 4.5 foot from<br />
the ground. This measurement<br />
is then used to create an estimate<br />
<strong>for</strong> the biomass of the area<br />
of <strong>for</strong>estry in question.<br />
Security and Contingency<br />
Mapping<br />
A final and possibly unexpected<br />
use <strong>for</strong> both ZEB units<br />
is in the ever-growing realm<br />
of security. In an increasingly<br />
uncertain world, governments,<br />
police <strong>for</strong>ces, security agencies<br />
and indeed even companies are<br />
increasingly security-conscious<br />
and are turning to new technologies<br />
to increase their security.<br />
ZEB1 units have been in use by<br />
a number of police <strong>for</strong>ces since<br />
their launch in 2013. Their<br />
speed, ease of use and high<br />
mobility make them the perfect<br />
tool <strong>for</strong> capturing the details of<br />
a crime scene, accident scene, or<br />
<strong>for</strong> mapping a building or site<br />
of interest. In the case where<br />
speed is of the essence (<strong>for</strong> example,<br />
after a RTC on a major<br />
road) the ZEB unit can be deployed<br />
in seconds, with a scan<br />
complete in a few minutes. This<br />
allows <strong>for</strong> a fully 3 dimensional<br />
image, accurate to within a few<br />
centimetres, to be gained.<br />
The development of the autonomous<br />
ZEB-REVO<br />
has obvious benefits in<br />
these areas. In the case<br />
of a crime scene, the polemounted<br />
ZEB-REVO may be<br />
deployed, to ensure that areas<br />
of interest are not touched or<br />
disturbed.<br />
Where there is a risk to human<br />
health (<strong>for</strong> example, a bomb<br />
threat, or an unsecure building),<br />
the REVO can be trolley<br />
mounted (as in mining) and<br />
sent in alone to scan the area of<br />
interest.<br />
It is our prediction that the<br />
realms of security and reconnaissance,<br />
there will be increasing<br />
demand <strong>for</strong> this type of<br />
rapid, mobile, versatile surveying<br />
tools.<br />
The Future<br />
So what does the future hold<br />
<strong>for</strong> GeoSLAM? In a rapidly<br />
growing, rapidly changing<br />
industry, standing still is<br />
quite simply not an option.<br />
GeoSLAM will continue to<br />
respond to new challenges, new<br />
technological developments,<br />
and to identify new areas of application.<br />
Be sure to pay attention<br />
to <strong>for</strong>thcoming GeoSLAM<br />
announcements, to hear more<br />
about these highly exciting developments<br />
in the pipeline.<br />
KEYWORDS<br />
GeoSLAM; ZEB-REVO; scan<br />
ABSTRACT<br />
GeoSLAM is a manufacturer and supplier<br />
of handheld, 3D mobile mapping<br />
systems. Founded in 2012 and<br />
headquartered in the UK, GeoSLAM now<br />
has a global distribution network of 35<br />
distributors across six continents.<br />
AUTHOR<br />
Stuart Cadge,<br />
Pre Sales Engineer at GeoSLAM<br />
For more in<strong>for</strong>mation, please visit<br />
www.geoslam.com<br />
info@geoslam.com<br />
Fig. 8 - Point<br />
cloud data of an<br />
area of <strong>for</strong>estry<br />
with a section<br />
taken at BHD<br />
height <strong>for</strong> biomass<br />
Special Supplement to <strong>GEOmedia</strong> Journal Issue n°3-<strong>2016</strong> 25<br />
calculation.
<strong>INTERGEO</strong><br />
26 Special Supplement to <strong>GEOmedia</strong> Journal Issue n. 3-<strong>2016</strong>
<strong>INTERGEO</strong><br />
<br />
<br />
<br />
<br />
<br />
<br />
<br />
<br />
<br />
<br />
<br />
<br />
<br />
<br />
Special Supplement to <strong>GEOmedia</strong> Journal Issue n°3-<strong>2016</strong> 27
<strong>INTERGEO</strong><br />
Study and development of<br />
a GIS <strong>for</strong> fire-fighting activities<br />
based on INSPIRE directive<br />
by Andrea Maria Lingua, Marco Piras,<br />
Maria Angela Musci, Francesca<br />
Noardo, Nives Grasso, Vittorio Verda<br />
In the past years, the European Union has<br />
invested in the development of the INSPIRE<br />
Directive to support environmental policies<br />
and actually EU is currently working on<br />
developing "ad hoc" infrastructures <strong>for</strong> the<br />
safe management of <strong>for</strong>ests and fires.<br />
Fig. 1 – External model definition.<br />
The activities connected<br />
to the <strong>for</strong>est-fire fighting<br />
could be essentially<br />
divided in three parts: be<strong>for</strong>e,<br />
during and after the fire.<br />
In these activities, the most<br />
complex are the monitoring and<br />
management of at-risk fire zones<br />
and fire-fighting procedures e<strong>special</strong>ly<br />
<strong>for</strong> large fires (> 40ha).<br />
In the case of “big fire”, which<br />
are fires with a very large extension,<br />
the main problem is the<br />
coordination between the human<br />
resources (ground, marine<br />
and air) which work to fight<br />
the fires. This aspect is more<br />
critical when the fire is across<br />
the boundary, because there is<br />
not a European protocol <strong>for</strong><br />
interventions and each country<br />
has different procedures and<br />
CONOPS (concept of operations).<br />
Thus becomes clear the<br />
complex reality that competent<br />
authorities must handle in such<br />
emergencies (Andrews and Rothermel<br />
1982; Bovio 1993; Teie<br />
2005).<br />
The AF3 project (Advanced Forest<br />
Fire Fighting) is part of the<br />
7 th Framework Program and it is<br />
focused on the prevention and<br />
the management of big <strong>for</strong>estfires<br />
through the development<br />
of innovative techniques. The<br />
AF3 purpose is to improve the<br />
efficiency of fire-fighting operations<br />
in progress and the protection<br />
of human lives and heritage<br />
by developing innovative technologies<br />
to ensure the integration<br />
between existing and new<br />
systems. Furthermore, the AF3<br />
project aims to increase interoperability<br />
among firefighting<br />
supports (Chuvieco et al 2010).<br />
The project defines a unique<br />
control center devoted to coordinate<br />
all activities, from monitoring<br />
to the intervention on<br />
field. Among the technological<br />
aspects, the project provides the<br />
design of an SDI plat<strong>for</strong>m (Spatial<br />
Data Infrastructure) which<br />
is essentially based on a GIS<br />
(Geographic In<strong>for</strong>mation System).<br />
In the following sections,<br />
GIS model proposed <strong>for</strong> a part<br />
of the system will be described.<br />
This GIS is structured according<br />
to INSPIRE ( Infrastructure <strong>for</strong><br />
Spatial In<strong>for</strong>mation in Europe)<br />
Directive.<br />
Fig. 2 Steps to create AF3 Database in PostgreSQL and Q-GIS.<br />
28 Special Supplement to <strong>GEOmedia</strong> Journal Issue n. 3-<strong>2016</strong>
<strong>INTERGEO</strong><br />
GIS and fire-fighting: a<br />
brief description of the<br />
European scenario<br />
Currently, in Europe there are<br />
already several GIS useful <strong>for</strong> decision<br />
support at different stages<br />
of fire management. However,<br />
the opportunity to have both<br />
updated or real-time data, and<br />
a complete and consistent in<strong>for</strong>mation,<br />
is often missing. E<strong>special</strong>ly<br />
it is difficult to have an<br />
actual data interoperability with<br />
the existing available technologies.<br />
In most cases, the in<strong>for</strong>mation<br />
collected in the GIS are incomplete<br />
and they concern only<br />
one phase of the overall management<br />
process. There are, indeed,<br />
systems used, exclusively,<br />
<strong>for</strong> prediction or <strong>for</strong> planning or<br />
emergency control. In this way, a<br />
lot of in<strong>for</strong>mation is lost. However,<br />
this historical in<strong>for</strong>mation<br />
could be helpful to make more<br />
comprehensive the tool <strong>for</strong> decision<br />
support. Furthermore, it<br />
lacks a central system to register<br />
distribution and availability of<br />
resources in risk periods, standardized<br />
systems <strong>for</strong> fires registry<br />
and systematic registration systems<br />
of firefighting operations.<br />
Finally, the metadata of the observed<br />
maps are not always available<br />
and the data validity is impossible<br />
to be determined.<br />
For example, in Europe, Web-<br />
GIS known as EFFIS (European<br />
Forest Fire In<strong>for</strong>mation System<br />
http://<strong>for</strong>est.jrc.ec.europa.eu/effis/)<br />
was developed by the JRC<br />
(Joint Research Centre). This<br />
GeoDB, still under construction,<br />
records only the data related<br />
to fire risk analysis and the<br />
occurred fires in Europe.<br />
Description of the GIS in AF3<br />
In order to propose an innovative<br />
GIS plat<strong>for</strong>m devoted to<br />
support the big <strong>for</strong>est fires management,<br />
the following activities<br />
must be considered: <strong>for</strong>ecasting,<br />
monitoring, planning, active<br />
fight and post-fire practices.<br />
Nowadays, the modern system is<br />
not designed <strong>for</strong> a specific enduser<br />
and it stands out <strong>for</strong> its versatility.<br />
However, it is possible to<br />
establish different authorization<br />
<strong>for</strong> different users and method<br />
of use.<br />
In order to realize the dedicated<br />
GIS <strong>for</strong> AF3, the traditional<br />
modelling process was followed.<br />
As well known, needs to pass<br />
from the complexity of the reality<br />
to a <strong>for</strong>mal schema describing<br />
entities and tools used in<br />
fire-fighting operations.<br />
External Model<br />
The first step was the development<br />
of an external model. In<br />
this model, the useful in<strong>for</strong>mation<br />
could be gathered in three<br />
categories of objects: the competent<br />
authorities (command), the<br />
objects to be protected (territory),<br />
the event and the ignition<br />
point (fire and hotspot) (Figure<br />
1). In the case of AF3, there<br />
is only one control center that<br />
handles local operations centers,<br />
the terrestrial and aerial troops.<br />
The command center (command<br />
center) is the national control<br />
center. Local operations centers<br />
(operating center) are in charge to<br />
monitor and to fill register of the<br />
fire cadaster and the mission report.<br />
Instead, the teams (operating<br />
team) take care of active fight<br />
on the field.<br />
Conceptual and<br />
Logical Model<br />
(INSPIRE oriented)<br />
Next steps are the definition<br />
of conceptual and logical models.<br />
There<strong>for</strong>e, these stages consist<br />
in identification of entities,<br />
attributes, definition of relationships<br />
between the entities and<br />
the data <strong>for</strong>mats. The INSPIRE<br />
directive, thus, provides fundamentals<br />
<strong>for</strong> completely defining<br />
the in<strong>for</strong>mation layers closely<br />
related to the land description<br />
(e.g. digital terrain model and<br />
digital surface model), the event<br />
progression (e.g. time) and meteorological<br />
data (e.g. wind<br />
direction and speed, temperature,<br />
humidity). This European<br />
specification has a general nature,<br />
which needs to be suitably<br />
extended <strong>for</strong> adapting to the<br />
specific application. Some “ad<br />
hoc” entities are added in order<br />
to consider the data related to<br />
the command chain, fuel model<br />
and <strong>for</strong>est types definition (Burgan<br />
et al, 1998; Baskets 1999<br />
Baskets 2002; Han Shuting et al<br />
1987).<br />
Currently, it is necessary to<br />
highlight that in Italy, as in Europe,<br />
a systematic survey and<br />
monitoring of the <strong>for</strong>ests are<br />
missing. Moreover, standardized<br />
methodology <strong>for</strong> the preparation<br />
of suitable fuel models does<br />
not exist.<br />
Fig. 3 – Flow-chart of<br />
alarm trigger.<br />
Special Supplement to <strong>GEOmedia</strong> Journal Issue n°3-<strong>2016</strong> 29
<strong>INTERGEO</strong><br />
Considering these aspects,<br />
an approximation<br />
on the fuel models has<br />
been done. In particular, in<br />
Italy, the only achieved result is<br />
a regional classification of <strong>for</strong>est<br />
types, but it cannot be considered<br />
equally valid <strong>for</strong> the calculation<br />
of the danger indexes. The<br />
development of this <strong>issue</strong> would<br />
improve our capacity of fire <strong>for</strong>ecasting<br />
and, consequently, in the<br />
fire-fighting management.<br />
Fig. 4 – Example of query: hotspot and operating centre localization (left) and operating<br />
team localization (right).<br />
Internal Model<br />
Open source plat<strong>for</strong>ms were<br />
chosen to implement the database.<br />
Specifically, PgAdmin<br />
III were used to manage the<br />
database PosgreSQL with its<br />
spatial extension PostGIS and<br />
the graphical interface. This<br />
software allows the creation of<br />
tables and relationships, the<br />
implementation of triggers and<br />
queries, the realization of views<br />
<strong>for</strong> users and different uses and<br />
finally the semi-automatic input<br />
of data. This system is not<br />
equipped with a graphical interface<br />
to visualize the spatial data,<br />
there<strong>for</strong>e a connection with Q-<br />
GIS was realized.Thus, the procedure<br />
of GeoDB implementation<br />
follows the steps shown in<br />
Figure 2.<br />
A peculiarity of the internal<br />
model was the trigger, which is<br />
an “ad hoc” procedure <strong>for</strong> the<br />
automatic manipulation (insertion,<br />
modification and deletion)<br />
of in<strong>for</strong>mation related to a triggering<br />
event (Perry 1990). To<br />
complete the automatic management<br />
of the entire system, a<br />
large number of triggers must<br />
be implemented. Below as example,<br />
it has been described the<br />
"trigger" that starts when fire<br />
alarm is activated.<br />
In this specific case, when the<br />
alarm is recorded in the system,<br />
the program executes the procedure<br />
schematically shown in the<br />
flow-chart in Figure 3.<br />
Case of study (Sardinia)<br />
Data<br />
In order to test the GIS functionalities,<br />
a specific test site has<br />
been selected. In particular, a<br />
database related to South part of<br />
the Sardinia (close to Cagliari)<br />
has been considered.<br />
There<strong>for</strong>e, defined a specific<br />
area, all fundamental data have<br />
been collected, where the most<br />
important in<strong>for</strong>mation are the<br />
state of the <strong>for</strong>ests, fuel models,<br />
water resource localization,<br />
roads and technological networks,<br />
command center, operational<br />
centers, teams, meteorological<br />
data, hotspots, alarm<br />
have been inserted.<br />
Using these in<strong>for</strong>mation layers,<br />
which are suitably designed and<br />
compiled, using QGIS, it was<br />
possible to realize an example<br />
of a query on the system. Since<br />
the alarm is activated (Figure 4<br />
- left), the trigger is able to automatically<br />
calculate the competent<br />
command center, the<br />
nearest operating center, with<br />
the adapted number of men and<br />
assets. Finally, in real- time, data<br />
of the team and its location can<br />
be displayed (Figure 4 - right).<br />
On the field, the team will be<br />
monitored and managed by<br />
the command center, by means<br />
of the automatic registration<br />
of their coordinates (Figure 5),<br />
measuring in real time the team<br />
position.<br />
Conclusion<br />
The developed GIS model describes<br />
only a part of the “fire<br />
prevention and management<br />
system” provided by the AF3<br />
project, but its complexity is<br />
Fig. 5 – Example<br />
of query<br />
and trigger<br />
visualization.<br />
Real time team<br />
positioning on<br />
the field.<br />
30 Special Supplement to <strong>GEOmedia</strong> Journal Issue n. 3-<strong>2016</strong>
quite evident. E<strong>special</strong>ly,<br />
it underlines that it is<br />
difficult (in some case<br />
almost impossible), to<br />
define exactly some entities<br />
(e.g. Fuel model or<br />
fuel moisture). Moreover,<br />
an unique European<br />
procedure does not exist,<br />
there<strong>for</strong>e it is very complicated<br />
to define the<br />
CONOPS and a system<br />
with a single command<br />
center.<br />
The proposed model<br />
shows that also the open<br />
source plat<strong>for</strong>ms allow<br />
to realize a complex SDI<br />
structure. The triggering<br />
system <strong>for</strong> the automatic<br />
procedures allows to add<br />
value to SDI, because it<br />
makes the system realtime<br />
responsive.<br />
Acknowledgements<br />
The authors would like<br />
to thank the CVVFF of<br />
Cagliari <strong>for</strong> their availability<br />
and data sharing.<br />
Furthermore they thank<br />
Dr. Raffaella Marzano<br />
from University of Torino<br />
<strong>for</strong> her help about<br />
fuel model and <strong>for</strong>est<br />
type and Dr. Cesti <strong>for</strong> his<br />
availability.<br />
REFERENCES<br />
Andrews, P.L.and Rothermel R.C. (1982), Charts <strong>for</strong> interpreting wildland fire behaviour characteristics. <strong>INTERGEO</strong> USDA For. Serv. Gen. Tech.<br />
Rep. INT-131.<br />
Bovio G., (1993), Comportamento degli incendi boschivi estinguibili con attacco diretto. Monti e Boschi, 4: 19-24.<br />
Burgan, R.E., Klaver, R.W. & Klaver, JM. (1998), Fuel Models and Fire Potential from Satellite and Surface Observations, International<br />
Journal of WiIdIand Fire, 8: 159-170.<br />
Cesti G., Cesti C. (1999), Antincendio Boschivo. Manuale operativo per l’equipaggio dell’autobotte. Musumeci, Quart, Aosta, vol 2.<br />
Cesti G., (2002), Tipologie e comportamenti particolari del fuoco: risvolti nelle operazioni di estinzione, Il fuoco in <strong>for</strong>esta: ecologia e<br />
controllo. Atti del XXXIX Corso di Cultura in Ecologia. Università degli Studi di Padova, Regione del Veneto, Centro Studi per<br />
l’Ambiente Alpino, S. Vito di Cadore, 2-6 settembre 2002: 77-116.<br />
Perry, D. G. (1990), Wildland Firefighting: Fire Behavior, Tactics, and Command, ed. Donald G. Perry.<br />
Teie, W. C. (2005), Firefighter’s Handbook on Wildland Firefighting, 3nd ed. Deer Valley. Chuvieco, E. et al., (2010). Development of<br />
a framework <strong>for</strong> fire risk assessment using remote sensing and geographic in<strong>for</strong>mation system technologies.<br />
Han Shuting, Han Yibin, Jin Jizhong, Zhou Wei (1987), The method <strong>for</strong> calculating <strong>for</strong>est fire behaviour index, Heilongjiang Forest<br />
Protection Institute, Harbin, China, 77-82.<br />
http://www.s3lab.polito.it/progetti/progetti_in_corso/af3 (08/10/2014)<br />
http://<strong>for</strong>est.jrc.ec.europa.eu/effis/ (08/10/2014)<br />
http://www.isotc211.org/ (06/11/2014)<br />
http://inspire.ec.europa.eu/index.cfm/pageid/2 (03/11/2014)<br />
http://www.postgresql.org (05/05/2015)<br />
KEYWORDS<br />
INSPIRE directive; fire fighting; GIS<br />
ABSTRACT<br />
According to the Annual Fire Report 2013 (European Commission-Joint Research Centre, 2014), there have been 873 <strong>for</strong>est fires in<br />
Europe, in 2013, <strong>for</strong> a total of 340559 ha of territory. A comparison of this data to that of the previous years, highlights that, when<br />
the intended goal is that of preserving the environment and saving human lives, the importance of the correct management of <strong>for</strong>est<br />
fires can not be underestimated. In the past years, the European Union has invested in the development of the INSPIRE Directive<br />
(Infrastructure <strong>for</strong> Spatial In<strong>for</strong>mation in Europe) to support environmental policies. Furthermore, the EU is currently working on<br />
developing "ad hoc" infrastructures <strong>for</strong> the safe management of <strong>for</strong>ests and fires.<br />
The AF3 EU project (Advanced Forest Fire Fighting), financed by the FP7, addresses the <strong>issue</strong> of developing innovative tools to handle<br />
all stages of <strong>for</strong>est fires. The project develops a single control center <strong>for</strong> the coordination of monitoring, manoeuvring, and post-fire<br />
operations. The SDI plat<strong>for</strong>m (Spatial Data Infrastructure) represents another component which was designed in the context of this<br />
project. It is based on a GIS (Geographic In<strong>for</strong>mation System) which is able to efficiently integrate multi-modal data.<br />
Following an analysis of the state of the art of in<strong>for</strong>mation systems <strong>for</strong> <strong>for</strong>est fire-fighting, and in light of the end-user requirements<br />
analyzed within the AF3 project, we propose a geo-topographic database based on the INSPIRE Directive and developed on opensource<br />
plat<strong>for</strong>ms, which provides interoperability of the data and allows <strong>for</strong>ecasting and monitoring of high-risk areas, decision making,<br />
damage estimation, and post-fire management.<br />
AUTHOR<br />
Andrea Maria Lingua<br />
Marco Piras, Maria Angela Musci, Francesca Noardo, Nives Grasso, Vittorio Verda<br />
Politecnico di Torino - Dipartimento di Ingegneria dell'ambiente,<br />
del territorio e delle infrastrutture (DIATI)<br />
Vittorio Verda<br />
Politecnico di Torino - DIpartimento di Energia (DENERG)<br />
EDITORS NOTE<br />
This work has been presented at the 19th Conference ASITA 2015 (Lecco). We would like to thank the organizing secretary <strong>for</strong> the<br />
courtesy and his availability and wishes the best outcome <strong>for</strong> the 20th Conference ASITA <strong>2016</strong> (Cagliari 8-9-10 November <strong>2016</strong>).<br />
• Rilievi batimetrici automatizzati<br />
• Fotogrammetria delle sponde<br />
• Acquisizione dati e immagini<br />
• Mappatura parametri ambientali<br />
• Attività di ricerca<br />
Vendita – Noleggio - Servizi chiavi in mano, anche con strumentazione cliente<br />
Special Supplement to <strong>GEOmedia</strong> Journal Issue n°3-<strong>2016</strong> 31
<strong>INTERGEO</strong><br />
A survey from<br />
UAV in critical<br />
areas: the<br />
advantages of<br />
technology in<br />
areas with<br />
complex terrain<br />
by Zaira Baglione<br />
The tale of two experiences in the geological and cultural heritage area through the use of fixed-wing drones.<br />
Innovation and high quality of the data returned from an aero-photogrammetric survey as support to the activities of<br />
the different professionals. From the survey phase to the post-production all the precautions to obtain images with a<br />
very good resolution and solve obstacles <strong>for</strong> the mapping of areas not easily accessible such as quarries.<br />
The aerial photography<br />
have had a great revolution<br />
with the advent<br />
of the UAV technology that<br />
actually has allowed to overcome<br />
the objective problems of<br />
the access to the in<strong>for</strong>mation.<br />
E<strong>special</strong>ly <strong>for</strong> the territories<br />
with a complex topography, the<br />
use of drones is an advantage<br />
in terms of speed, cost reduction<br />
and achievement of high<br />
quality results. The applications<br />
of the proximity remote sensing<br />
in critical areas are a lot<br />
and involve many areas: from<br />
geology to engineering, from<br />
surveillance to environmental<br />
monitoring, civil protection,<br />
archeology and more.<br />
In particular it is recommended,<br />
<strong>for</strong> several reasons, the use<br />
of fixed-wing models <strong>for</strong> the<br />
survey of medium-high extension<br />
surfaces. Meanwhile, this<br />
type of APR provides a greater<br />
flying range than the multicopter<br />
models (which generally<br />
have shorter range, considering<br />
also the take-off and landing<br />
operations), in fact with a single<br />
flight it is possible to cover areas<br />
of several kilometers and obtain<br />
uni<strong>for</strong>m images, then with a<br />
very appreciable qualitative output;<br />
in addition the control of<br />
the flight parameters is efficient<br />
and it is possible to resists to the<br />
adverse environmental conditions,<br />
supporting wind gusts of<br />
up to 60 km/h. The fixed-wing<br />
aircraft, in general, are perfect<br />
<strong>for</strong> the applications in geology<br />
and archaeological surveys. Two<br />
interesting experiences, related<br />
respectively to the geological<br />
and cultural heritage area, are<br />
described below by Gabriele<br />
Santiccioli, FlyTop president<br />
and member of the Provincial<br />
Board of Surveyors and<br />
Surveyors Graduates of Rome.<br />
Certainly a very growing sector<br />
is the quarries monitoring<br />
through precise mapping activities<br />
to accurately control the<br />
excavations, to know exactly the<br />
amount of material removed<br />
and prevent any movement of<br />
materials and the risk of landslides.<br />
A proof of the quality<br />
of the remote control systems<br />
<strong>for</strong> this type of professional application<br />
is given by Gabriele<br />
Santiccioli, president of FlyTop,<br />
through a project carried out in<br />
a mining quarry in the north<br />
of Italy. "We enthusiastically<br />
accepted the engagement by<br />
the responsible Authority <strong>for</strong><br />
the exploitation of a quarry<br />
in Emilia Romagna - says the<br />
president Santiccioli - because<br />
it meant <strong>for</strong> us to win a challenge.<br />
This experimentation<br />
yook place in an extremely<br />
mountainous area, undoubtedly<br />
challenging under the aeronautical<br />
profile. We used a fixedwing<br />
aircraft, FlyGeo24Mpx,<br />
a unique drone in its category<br />
32 Special Supplement to <strong>GEOmedia</strong> Journal Issue n. 3-<strong>2016</strong>
<strong>INTERGEO</strong><br />
equipped with technology to<br />
fly at a fixed altitude. Generally<br />
this type of critical reconnaissance<br />
is carried out with a<br />
multirotor drone, but the fixed<br />
wing flexibility allowed us to<br />
successfully conclude the mission.<br />
The conditions were not<br />
easy, considering the extension<br />
of the area to be analysed, about<br />
95 hectares, and the difference<br />
in height of 360 meters between<br />
the top and the valley of<br />
the quarry. However, with a single<br />
flight, we have acquired in<br />
25 minutes nearly five hundred<br />
pictures with a resolution of 2.5<br />
cm per pixel ". With regard to<br />
the mining activity in the quarries<br />
it must be said that both<br />
private interests, relating to<br />
companies that hold the regional<br />
authorizations, both public<br />
are involved at the same time,<br />
considering that some of them<br />
represent a heritage that should<br />
be used in an intelligent<br />
manner and preserve the<br />
environment. The UAV is<br />
a good instrument from<br />
many points of view: it<br />
allows to rationalize the excavation<br />
areas on the basis<br />
Special Supplement to <strong>GEOmedia</strong> Journal Issue n°3-<strong>2016</strong> 33
<strong>INTERGEO</strong><br />
of what is known from<br />
the restitution of photos<br />
and the subsequent study<br />
and post-processing; they<br />
provide in<strong>for</strong>mation relating<br />
to the amount of material removed<br />
and, finally, they are the<br />
only possible solution to reach<br />
critical areas that may only be<br />
known with the conventional<br />
aerial photogrammetry systems<br />
and with inevitable higher costs.<br />
"In order to plan the operation<br />
we referred to a regional technical<br />
map (CTR) - continues<br />
Santiccioli - and we decided<br />
to set a fixed altitude of 130<br />
meters. Through some control<br />
points on the ground we made<br />
12 strips with an overlap of 70<br />
percent between each photo,<br />
acquiring one frame every 25<br />
meters. We got a 3D model of<br />
the quarry, a cloud of points,<br />
the DTM and DSM from the<br />
restitution and we processed all<br />
the photogrammetric data with<br />
a <strong>special</strong> software characterized<br />
by a very high level of metric<br />
accuracy. We can say that this<br />
result satisfied the client and<br />
FlyTop, that realized the work."<br />
The application of the UAV<br />
technology has grown significantly<br />
also <strong>for</strong> the cultural heritage<br />
sector, not only <strong>for</strong> monitoring<br />
and documentation,<br />
but e<strong>special</strong>ly <strong>for</strong> the discovery<br />
activities. With the partnership<br />
started between the University<br />
of Salento and FlyTop an<br />
archaeological survey was carried<br />
out in the Veio Park area,<br />
a few kilometers from Rome,<br />
in an area between the towns<br />
of Formello and Isola Farnese.<br />
Gabriele Santiccioli together<br />
with Professor of ancient topography<br />
Giuseppe Ceraudo describes<br />
the survey done with the<br />
fixed wing UAV FlyGeo24Mpx<br />
that led to the identification of<br />
ancient Etruscan and Roman<br />
settlements, in particular the<br />
remains of structures of buildings<br />
and streets.<br />
The discovery<br />
comes from a<br />
research project<br />
that the University<br />
of Salento leads<br />
<strong>for</strong> over ten years<br />
and had a decisive<br />
result last<br />
year following the<br />
mission that led<br />
to the discovery<br />
of a city system<br />
of Etruscan and<br />
Roman eras. The<br />
area covered by<br />
the flight (about<br />
<strong>for</strong>ty hectares) was<br />
overflown with a<br />
fixed-wing drone<br />
equipped with<br />
a 24Mpx digital<br />
camera with single<br />
focal length lens.<br />
The operation<br />
involved the town<br />
of Archi di Pontecchio and was<br />
carried out in compliance with<br />
ENAC specifications. The flight<br />
has enabled to acquire images<br />
of the highest quality, almost<br />
two hundred pictures with a<br />
resolution of 1.7 cm per pixel,<br />
geo-referenced and complete of<br />
3 parameters of translation and<br />
rotation. Through the captured<br />
frames there was a validation<br />
of what were until now only<br />
hypotheses; observing from the<br />
sky the differentiated growth of<br />
vegetation, in fact, it has been<br />
recognized part of the ancient<br />
Etruscan city of Veio.<br />
About the accuracy of aerial<br />
photogrammetric data Gabriele<br />
Santiccioli says: "Our company<br />
has always been committed to<br />
combine innovation and integration,<br />
so we have used all the<br />
instruments that the surveyor<br />
has, arriving until the production<br />
of maps of high technical<br />
quality in few hours. We have<br />
obtained a cloud of points, a<br />
3D model, the DTM and DSM<br />
from the elaborate digital images<br />
in order to know better<br />
the morphology of the land.<br />
Considering the future scenarios,<br />
I do not exclude that shortly<br />
the application of thermal and<br />
multispectral sensors will enter<br />
in the archaeological sector or at<br />
least one study focused on the<br />
result that could be achieved".<br />
The aero-photogrammetric<br />
proximity survey with the use<br />
of an APR represents an archaeological<br />
survey interesting<br />
landscape, as well as a real and<br />
accessible system <strong>for</strong> the study<br />
of preliminary research. Later,<br />
with subsequent investigations<br />
and excavations, it will be able<br />
to determine more accurately<br />
the reference period and other<br />
more detailed in<strong>for</strong>mations.<br />
The survey done in the quarry<br />
and the result of Veio demonstrate<br />
how the remote sensing of<br />
proximity through RPAS is advantageous<br />
in terms of time and<br />
costs, e<strong>special</strong>ly <strong>for</strong> particularly<br />
extended areas of inspection or<br />
not easily accessible.<br />
34 Special Supplement to <strong>GEOmedia</strong> Journal Issue n. 3-<strong>2016</strong>
<strong>INTERGEO</strong><br />
The aero-photogrammetric<br />
proximity survey with the<br />
UAV use represents an<br />
interesting vision of the<br />
archaeological survey, as<br />
well as a concrete and accessible<br />
system <strong>for</strong> the study<br />
of preliminary researches.<br />
Later, with subsequent<br />
investigations and excavations,<br />
it will be able to determine<br />
more accurately the<br />
reference period and other<br />
more detailed in<strong>for</strong>mation.<br />
Both the survey done in<br />
the quarry and the Veio<br />
result demonstrate how the<br />
remote sensing of proximity<br />
through the use of on<br />
UAV is useful in terms of<br />
time and costs, e<strong>special</strong>ly<br />
<strong>for</strong> particularly large areas<br />
of inspection or not easily<br />
accessible.<br />
KEYWORDS<br />
UAV; cultural heritage;<br />
survey; aerophotogrammetry<br />
ABSTRACT<br />
The tale of two experiences<br />
in the geological<br />
and cultural<br />
heritage area through<br />
the use of fixed-wing<br />
drones. Innovation<br />
and high quality of<br />
the data returned<br />
from an aero-photogrammetric<br />
survey<br />
as support to the activities<br />
of the different<br />
professionals. From<br />
the survey phase to<br />
the post-production<br />
all the precautions to<br />
obtain images with a<br />
very good resolution<br />
and solve obstacles <strong>for</strong><br />
the mapping of areas<br />
not easily accessible<br />
such as quarries.<br />
AUTHOR<br />
Zaira Baglione<br />
zaira@flytop.it<br />
Account manager<br />
Flytop<br />
Special Supplement to <strong>GEOmedia</strong> Journal Issue n°3-<strong>2016</strong> 35
<strong>INTERGEO</strong><br />
NEWS<br />
Sun, water and<br />
hydromethane:<br />
possible options<br />
<strong>for</strong> the energy<br />
future of the<br />
Smart Cities<br />
The Italian engineering company<br />
Geocart S.p.A. (www.geocart.net),<br />
in the context of the<br />
urban planning according to<br />
the "Smart Cities" approach,<br />
has focused its attention on the<br />
search <strong>for</strong> new solutions <strong>for</strong> the<br />
production of energy from renewable<br />
sources and resources<br />
and the development of innovative<br />
techniques <strong>for</strong> the monitoring<br />
of energy efficiency.<br />
The final objectives of the<br />
study are threefold:<br />
1. mapping of potential hydroelectric<br />
productivity<br />
from mini and micro-hydro<br />
plants;<br />
2. study on the feasibility of optimal<br />
hydromethane generation<br />
from renewable sources;<br />
3. analysis of the efficient use<br />
of solar resource on an urban<br />
scale.<br />
In addition to the estimation<br />
of the potential productivity<br />
of hydropower, the objective<br />
of the study is to understand<br />
the feasibility of optimal hydromethane<br />
generation from<br />
renewable sources and its use<br />
<strong>for</strong> public transport in urban<br />
areas or high environmental<br />
value areas. The activity aims<br />
to respond to market needs:<br />
the various existing technologies<br />
<strong>for</strong> hydrogen storage are<br />
not fully satisfactory in terms<br />
of efficiency, convenience and<br />
af<strong>for</strong>dability. A fundamental<br />
aspect of the activity is the generation<br />
of hydrogen-methane<br />
mixtures having a maximum<br />
hydrogen content of 30%<br />
by volume, easier to use than<br />
pure hydrogen: in fact, the hydromethane<br />
can be used in a<br />
normal natural gas engine.<br />
For the analysis of the solar<br />
potential of the urban area, the<br />
research is based on 3D mapping<br />
of city buildings, as a further<br />
instrument of knowledge,<br />
including <strong>for</strong> policy makers,<br />
of the effective potential use<br />
of solar resource on building<br />
patrimony, and as a policy instrument<br />
<strong>for</strong> the planning of<br />
new construction areas. In this<br />
context, particular attention is<br />
paid to the study of the energy<br />
exchanges of the urban area<br />
and the so-called urban heat<br />
islands.<br />
www.geocartspa.it<br />
(Source: Geocart)<br />
Location-based data<br />
and services enabling a<br />
geosmartcity<br />
Any smart-city implementation<br />
leveraging location-based data<br />
and services is undoubtedly<br />
reaching faster its sustainability<br />
aims. The EU co-funded project<br />
GeoSmartCity is contributing<br />
to this, establishing a cross-plat<strong>for</strong>m,<br />
re-usable and open hub<br />
in which different categories of<br />
users can discover and access interoperable<br />
geographic in<strong>for</strong>mation,<br />
by means of generic-purpose<br />
as well as <strong>special</strong>ized services<br />
based on open standards.<br />
The GeoSmartCity approach is<br />
applied in two different urban<br />
contexts (the Green-Energy scenario,<br />
to support the implementation<br />
of sustainable energy policies<br />
,and the Underground scenario,<br />
to support the integrated<br />
management of underground<br />
utility infrastructures) and tested<br />
by 11 pilots, consisting of<br />
cities/regions from 8 different<br />
Member States.<br />
The underlying layer of the<br />
overall GeoSmartCity architecture<br />
consists of interoperable<br />
georeferenced and semantically<br />
reach spatial datasets, which<br />
have been harmonized according<br />
to common data models<br />
which extend INSPIRE application<br />
schemas on Buildings<br />
and Utilities & Governmental<br />
Services and have been made<br />
discoverable and accessible by<br />
means of OGC webservices.<br />
http://www.epsilon-italia.it/IT<br />
(Source: Epsilon Italia)<br />
Leica Pegasus<br />
Backpack<br />
The Leica Pegasus:Backpack is<br />
an award-winning wearable reality<br />
capture sensor plat<strong>for</strong>m. A<br />
highly ergonomic design combines<br />
five cameras offering fully<br />
calibrated 360 degrees view and<br />
two LiDAR profilers with an<br />
ultra-light carbon fibre chassis.<br />
It enables extensive and efficient<br />
indoor or outdoor documentation<br />
at a level of accuracy that is<br />
authoritative and professional.<br />
This unique mobile mapping<br />
solution is designed <strong>for</strong> rapid<br />
and regular reality capture. It is<br />
completely portable, enabling it<br />
to be checked in as luggage on<br />
a flight. The Pegasus:Backpack<br />
is designed to act a sensor plat<strong>for</strong>m<br />
with our standard external<br />
trigger and sync port outputs.<br />
BIM – map indoors, outdoors,<br />
underground, anywhere<br />
The Pegasus:Backpack makes<br />
progressive professional BIM<br />
documentation a reality. It synchronises<br />
imagery and point<br />
cloud data, there<strong>for</strong>e assuring<br />
a complete documentation<br />
of a building <strong>for</strong> full life cycle<br />
management. By using SLAM<br />
(Simultaneous Localisation<br />
and Mapping) technology and<br />
a high precision IMU, it ensures<br />
accurate positioning with<br />
GNSS outages.<br />
Industrial training – realitybased<br />
in<strong>for</strong>mation <strong>for</strong> fast<br />
response Knowing and understanding<br />
a landscape be<strong>for</strong>e<br />
rushing into emergency situations<br />
can save lives. Document<br />
any site in 3D models and<br />
images <strong>for</strong> fast, safe and efficient<br />
response. Combined with<br />
Autodesk, Intergraph and other<br />
software, reality-based industrial<br />
training is enhanced with<br />
the most accurate and current<br />
data sets. Safety & security – in<strong>for</strong>med<br />
decisions in emergency<br />
situations<br />
The Pegasus:Backpack helps<br />
you to make better and faster<br />
decisions in emergency situations<br />
due to access to more accurate<br />
data. Evacuation plans<br />
and route mapping benefit<br />
from clear and detailed images<br />
and point clouds that alert authorities<br />
to any changes. Access<br />
densely populated areas, providing<br />
accurate and current mapping<br />
to give city authorities a<br />
clearer and deeper understanding<br />
of the situation.<br />
Natural disaster response – minimise<br />
damage and save lives<br />
For the first time, responders<br />
to natural disasters can capture<br />
disaster area data in 3D on foot.<br />
Faster response times translate<br />
into lives saved and damage<br />
minimised. Capture the critical<br />
data needed to make faster and<br />
better in<strong>for</strong>med decisions that<br />
increases chances of survival and<br />
reconstruction.<br />
Contact us <strong>for</strong> more in<strong>for</strong>mation<br />
or to request a demo.<br />
www.geomatica.it<br />
(Source: Teorema srl)<br />
36 Special Supplement to <strong>GEOmedia</strong> Journal Issue n. 3-<strong>2016</strong>
SMART GEODATA –<br />
SMART CITIES<br />
GEOSPATIAL 4.0 –<br />
BIG DATA<br />
GEOBIM –<br />
DIGITAL CONSTRUCTION<br />
JOIN US NOW!<br />
WWW.<strong>INTERGEO</strong>.DE<br />
UK<br />
PARTNER COUNTRY <strong>2016</strong><br />
Host: DVW e.V.<br />
Conference organiser: DVW GmbH<br />
Trade fair organiser: HINTE GmbH<br />
SPONSORS: