Annual Report 2001 - KSPG AG
Annual Report 2001 - KSPG AG
Annual Report 2001 - KSPG AG

Create successful ePaper yourself
Turn your PDF publications into a flip-book with our unique Google optimized e-Paper software.
68<br />
Consolidated financial statements <strong>2001</strong> of Kolbenschmidt Pierburg <strong>AG</strong><br />
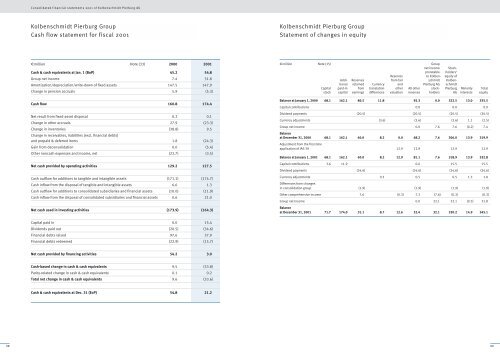
Kolbenschmidt Pierburg Group<br />
Cash flow statement for fiscal <strong>2001</strong><br />
€million Note (33) 2000 <strong>2001</strong><br />
Cash & cash equivalents at Jan. 1 (BoP) 45.2 54.8<br />
Group net income 7.4 31.8<br />
Amortization/depreciation/write-down of fixed assets 147.5 147.9<br />
Change in pension accruals 5.9 (5.3)<br />
Cash flow 160.8 174.4<br />
Net result from fixed-asset disposal 0.2 0.1<br />
Change in other accruals 27.9 (23.3)<br />
Change in inventories<br />
Change in receivables, liabilities (excl. financial debts)<br />
(38.8) 9.5<br />
and prepaid & deferred items 1.8 (24.3)<br />
Gain from deconsolidation 0.0 (5.4)<br />
Other noncash expenses and income, net (22.7) (3.5)<br />
Net cash provided by operating activities 129.2 127.5<br />
Cash outflow for additions to tangible and intangible assets (171.1) (174.7)<br />
Cash inflow from the disposal of tangible and intangible assets 6.6 1.3<br />
Cash outflow for additions to consolidated subsidiaries and financial assets (10.0) (11.9)<br />
Cash inflow from the disposal of consolidated subsidiaries and financial assets 0.6 21.0<br />
Net cash used in investing activities (173.9) (164.3)<br />
Capital paid in 0.0 15.4<br />
Dividends paid out (20.5) (34.6)<br />
Financial debts raised 97.6 37.9<br />
Financial debts redeemed (22.9) (15.7)<br />
Net cash provided by financing activities 54.2 3.0<br />
Cash-based change in cash & cash equivalents 9.5 (33.8)<br />
Parity-related change in cash & cash equivalents 0.1 0.2<br />
Total net change in cash & cash equivalents 9.6 (33.6)<br />
Cash & cash equivalents at Dec. 31 (EoP) 54.8 21.2<br />
Kolbenschmidt Pierburg Group<br />
Statement of changes in equity<br />
€million Note (15) Group<br />
net income Stockproratable<br />
holders’<br />
Reserves to Kolben- equity of<br />
Addi- Reserves from fair schmidt Kolbentional<br />
retained Currency and Pierburg <strong>AG</strong> schmidt<br />
Capital paid-in from translation other All other stock- Pierburg Minority Total<br />
stock capital earnings differences valuation reserves holders <strong>AG</strong> interests equity<br />
Balance at January 1, 2000 68.1 162.1 80.5 11.8 92.3 0.0 322.5 13.0 335.5<br />
Capital contributions 0.0 0.0 0.0<br />
Dividend payments (20.5) (20.5) (20.5) (20.5)<br />
Currency adjustments (3.6) (3.6) (3.6) 1.1 (2.5)<br />
Group net income 0.0 7.6 7.6 (0.2) 7.4<br />
Balance<br />
at December 31, 2000 68.1 162.1 60.0 8.2 0.0 68.2 7.6 306.0 13.9 319.9<br />
Adjustment from the first-time<br />
application of IAS 39 12.9 12.9 12.9 12.9<br />
Balance at January 1, <strong>2001</strong> 68.1 162.1 60.0 8.2 12.9 81.1 7.6 318.9 13.9 332.8<br />
Capital contributions 3.6 11.9 0.0 15.5 15.5<br />
Dividend payments (34.6) (34.6) (34.6) (34.6)<br />
Currency adjustments 0.5 0.5 0.5 1.3 1.8<br />
Differences from changes<br />
in consolidation group (1.9) (1.9) (1.9) (1.9)<br />
Other comprehensive income 7.6 (0.3) 7.3 (7.6) (0.3) (0.3)<br />
Group net income 0.0 32.1 32.1 (0.3) 31.8<br />
Balance<br />
at December 31, <strong>2001</strong> 71.7 174.0 31.1 8.7 12.6 52.4 32.1 330.2 14.9 345.1<br />
69
![PDF [1.0 MB] - KSPG AG](https://img.yumpu.com/5513074/1/171x260/pdf-10-mb-kspg-ag.jpg?quality=85)