Annual Report 2001 - KSPG AG
Annual Report 2001 - KSPG AG
Annual Report 2001 - KSPG AG

Create successful ePaper yourself
Turn your PDF publications into a flip-book with our unique Google optimized e-Paper software.
72<br />
Consolidated financial statements <strong>2001</strong> of Kolbenschmidt Pierburg <strong>AG</strong><br />
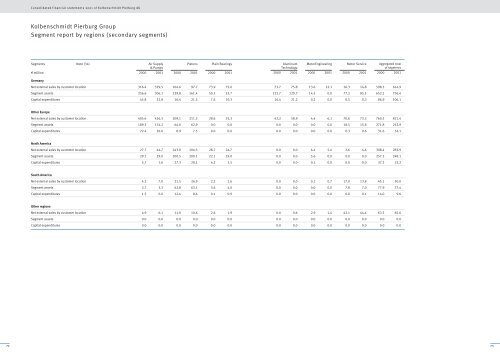
Kolbenschmidt Pierburg Group<br />
Segment report by regions (secondary segments)<br />
Segments Note (34)<br />
Germany<br />
Net external sales by customer location 316.4 329.5 104.6 97.7 73.9 75.0 73.7 75.8 13.6 22.1 16.3 14.8 598.5 614.9<br />
Segment assets 256.6 306.1 129.8 161.4 50.3 53.7 123.7 129.7 14.5 0.0 77.2 85.5 652.1 736.4<br />
Capital expenditures 45.8 52.8 16.4 21.5 7.6 10.3 16.4 21.2 0.2 0.0 0.5 0.3 86.9 106.1<br />
Other Europe<br />
Net external sales by customer location 405.6 426.3 209.1 211.5 28.6 35.3 42.2 58.9 4.4 6.1 70.6 73.3 760.5 811.4<br />
Segment assets 189.3 174.2 64.0 62.9 0.0 0.0 0.0 0.0 0.0 0.0 18.5 15.8 271.8 252.9<br />
Capital expenditures 22.4 26.0 8.9 7.5 0.0 0.0 0.0 0.0 0.0 0.0 0.3 0.6 31.6 34.1<br />
North America<br />
Net external sales by customer location 27.7 44.7 243.0 204.5 28.7 24.7 0.0 0.0 6.4 5.4 2.6 4.6 308.4 283.9<br />
Segment assets 29.1 29.0 200.5 200.1 22.1 19.0 0.0 0.0 5.6 0.0 0.0 0.0 257.3 248.1<br />
Capital expenditures 5.7 1.6 27.3 20.1 4.2 1.5 0.0 0.0 0.1 0.0 0.0 0.0 37.3 23.2<br />
South America<br />
Net external sales by customer location 4.2 7.0 21.5 26.9 2.2 1.6 0.0 0.0 0.2 0.7 17.0 13.8 45.1 50.0<br />
Segment assets 3.7 3.3 62.8 63.1 3.6 4.0 0.0 0.0 0.0 0.0 7.8 7.0 77.9 77.4<br />
Capital expenditures 1.5 0.0 12.4 8.6 0.1 0.9 0.0 0.0 0.0 0.0 0.0 0.1 14.0 9.6<br />
Other regions<br />
Air Supply<br />
& Pumps<br />
Pistons Plain Bearings Aluminum<br />
Technology<br />
MotorEngineering Motor Service Aggregated total<br />
of segments<br />
€million 2000 <strong>2001</strong> 2000 <strong>2001</strong> 2000 <strong>2001</strong> 2000 <strong>2001</strong> 2000 <strong>2001</strong> 2000 <strong>2001</strong> 2000 <strong>2001</strong><br />
Net external sales by customer location 4.9 6.1 11.0 10.6 2.6 1.9 0.0 0.6 2.9 1.4 42.1 44.4 63.5 65.0<br />
Segment assets 0.0 0.0 0.0 0.0 0.0 0.0 0.0 0.0 0.0 0.0 0.0 0.0 0.0 0.0<br />
Capital expenditures 0.0 0.0 0.0 0.0 0.0 0.0 0.0 0.0 0.0 0.0 0.0 0.0 0.0 0.0<br />
73
![PDF [1.0 MB] - KSPG AG](https://img.yumpu.com/5513074/1/171x260/pdf-10-mb-kspg-ag.jpg?quality=85)