- Page 1 and 2:
State of south african cities Repor
- Page 4 and 5:
The cities covered in the SoCR Limp
- Page 6 and 7:
FOREWORD by the Chairperson of the
- Page 8 and 9:
Buffalo city ekurhuleni ethekwini J
- Page 10 and 11:
Overview: State of South African Ci
- Page 12 and 13:
CH3 PRODUCTIVE CITIES Spatial trans
- Page 15 and 16:
INTRODUCTION Our cities: status quo
- Page 17 and 18:
State of Cities Reporting Over the
- Page 19 and 20:
Figure 1.2 shows the projected grow
- Page 21 and 22:
The consequence of this rapid urban
- Page 23 and 24:
LEARNING ACROSS BRICS: from city-re
- Page 25 and 26:
Addressing these challenges require
- Page 27 and 28:
TRANSFORMING OUR WORLD: THE 2030 AG
- Page 29 and 30:
Key issues for South African cities
- Page 31 and 32:
! ! ! ! ! ! ! ! ! ! ! ! Cities and
- Page 33 and 34:
Figure 1.8: Population change total
- Page 35 and 36:
Figure 1.10 shows that, while popul
- Page 37 and 38:
Significant densification through b
- Page 39 and 40:
Increased densities and demand have
- Page 41 and 42:
Global networks versus domestic res
- Page 43:
Informed by five years of research
- Page 46 and 47:
Key Messages 1 2 3 4 5 Spatial tran
- Page 48 and 49:
In cities, economic and social ineq
- Page 50 and 51:
Undesirable current spatial configu
- Page 52 and 53:
neighbouring municipalities are not
- Page 54 and 55: ! ! ! ! ! ! ! ! ! ! ! ! ! ! ! ! ! !
- Page 56 and 57: Built environment investments not s
- Page 58 and 59: The cost of fragmentation In additi
- Page 60 and 61: associated land uses benefit all, n
- Page 62 and 63: Local government is best placed to
- Page 64 and 65: Competing land interests need to be
- Page 66 and 67: PRE-1994 building POLICY 1994-2003
- Page 68 and 69: The 2011 State of South African Cit
- Page 70 and 71: The most recent National Household
- Page 72 and 73: Figure 2.6: Alternate transport-urb
- Page 74 and 75: SPATIAL TRANSFORMATION: Tracking tr
- Page 76 and 77: Spatial transformation needs respon
- Page 78 and 79: What is Required to Transform South
- Page 80 and 81: Transformation of management and ca
- Page 83 and 84: PRODUCTIVE CITIES Spatial transform
- Page 85 and 86: Introduction South Africa is headin
- Page 87 and 88: Congestion and pressure on resource
- Page 89 and 90: transportation networks. Land-use p
- Page 91 and 92: strategies in separate silos, with
- Page 93 and 94: The Economic Role and Performance o
- Page 95 and 96: • Johannesburg is South Africa’
- Page 97 and 98: Nevertheless, recent economic fores
- Page 99 and 100: • In the last five years, Tshwane
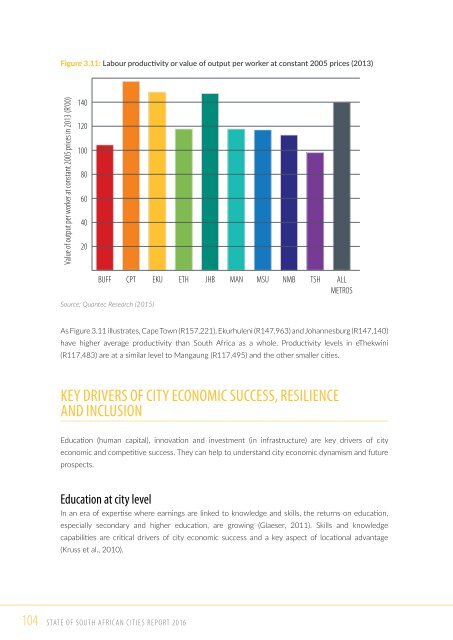
- Page 101 and 102: Figure 3.7 shows the average labour
- Page 103: Over the last 10 years, at a sector
- Page 107 and 108: Figure 3.13: Estimated city share o
- Page 109 and 110: Figure 3.15: City gross fixed-capit
- Page 111 and 112: development role set out in the 199
- Page 113 and 114: Table 3.3: Key economic development
- Page 115 and 116: • eThekwini has an active economi
- Page 117 and 118: Both types of township are low-inco
- Page 119 and 120: Informal economy and self-employmen
- Page 121 and 122: South Africa’s Expanded Public Wo
- Page 123: PRODUCTIVE CITIES 123 3
- Page 126 and 127: Key Messages 1 2 3 4 5 6 Cities sti
- Page 128 and 129: Andile’s story This is based on a
- Page 130 and 131: of that ward participate in making
- Page 132 and 133: Cape Town metro Mangaung Mamre Pell
- Page 134 and 135: These service delivery gains have c
- Page 136 and 137: YOUTH STUDY: Youth potential and vu
- Page 138 and 139: However, when the NWAC is superimpo
- Page 140 and 141: Tshwane, Figure 4.7: Johannesburg C
- Page 142 and 143: As mentioned, urban integration is
- Page 144 and 145: Table 4.2: Change in lowest income
- Page 146 and 147: Ethekwini metro Northdale Hambanath
- Page 148 and 149: Urban safety South Africa’s citie
- Page 150 and 151: City’s unemployment rate is about
- Page 152 and 153: Collective violence 7 Two main dime
- Page 154 and 155:
Towards More Inclusive Cities Citiz
- Page 156 and 157:
Furthermore, citizen education and
- Page 158 and 159:
South Africa requires a spatial pol
- Page 161 and 162:
SUSTAINABLE CITIES Leveraging the t
- Page 163 and 164:
Introduction Since 1994, the govern
- Page 165 and 166:
will need to have low-emissions gro
- Page 167 and 168:
Most of South Africa’s energy con
- Page 169 and 170:
Figure 5.3: Average baseline energy
- Page 171 and 172:
• Tshwane initiated its A Re Yeng
- Page 173 and 174:
WASTE: legislation, policies and pl
- Page 175 and 176:
500 0 400 200 0 2011 2013 2015 2017
- Page 177 and 178:
facility (i.e. waste is sorted manu
- Page 179 and 180:
Figure 5.10: Depiction of in- and o
- Page 181 and 182:
As Figure 5.12 shows, Cape Town and
- Page 183 and 184:
Accelerating the transition to sust
- Page 185 and 186:
disadvantaged groups, through facil
- Page 187 and 188:
Accelerating the transition to food
- Page 189 and 190:
Biodiversity South Africa is the th
- Page 191 and 192:
Open spaces Ecological and social o
- Page 193 and 194:
in the city and in their homes then
- Page 195 and 196:
Emissions reduction to mitigate cli
- Page 197 and 198:
Principles of a Sustainable City Ur
- Page 199:
Recommendations Develop and embed a
- Page 202 and 203:
Key Messages 1 2 3 4 5 Cities have
- Page 204 and 205:
informal political and social cultu
- Page 206 and 207:
Section 51 of the Municipal Systems
- Page 208 and 209:
While these dynamics are critical a
- Page 210 and 211:
Blurred intergovernmental responsib
- Page 212 and 213:
Access to information As many ward
- Page 214 and 215:
Figure 6.5: Turnout for national an
- Page 216 and 217:
COMMUNITY-BASED PLANNING: Strengthe
- Page 218 and 219:
The right people are not necessaril
- Page 220 and 221:
Local government will require new k
- Page 222 and 223:
All the cities have performance man
- Page 224 and 225:
Unethical behaviour is one of the r
- Page 226 and 227:
Figure 6.9: Municipal audit consist
- Page 228 and 229:
Service Delivery and Development As
- Page 230 and 231:
Still playing catch-up on basic ser
- Page 232 and 233:
knew anything about the city’s ID
- Page 234 and 235:
The established routines need to ch
- Page 237 and 238:
FINANCE and INNOVATION Sustainable
- Page 239 and 240:
Introduction With total expenditure
- Page 241 and 242:
In 2013/14, unauthorised, irregular
- Page 243 and 244:
Figure 7.2: Nelson Mandela Bay Muni
- Page 245 and 246:
The challenge is that the interface
- Page 247 and 248:
Phase 3: City autonomy and accounta
- Page 249 and 250:
National Treasury uses Uniform Fina
- Page 251 and 252:
As Figures 7.5 and 7.6 show, Johann
- Page 253 and 254:
In the case of property development
- Page 255 and 256:
distribution. Johannesburg’s capi
- Page 257 and 258:
• Despite this, the overwhelming
- Page 259 and 260:
Effectiveness of spending and servi
- Page 261 and 262:
cities have low capital expenditure
- Page 263 and 264:
An encouraging development is that
- Page 265 and 266:
3. Political interventions • Some
- Page 267 and 268:
Smart city strategies Smart city st
- Page 269 and 270:
encourage non-compliance. If priced
- Page 271 and 272:
• Municipalities could rightfully
- Page 273 and 274:
Recommendations If spatial transfor
- Page 275:
Finance and Innovation 275 7
- Page 278 and 279:
Key Messages 1 2 3 4 5 A Call to Ac
- Page 280 and 281:
1. The Spatial Transformation chapt
- Page 282 and 283:
Statements of intent in the SOCR St
- Page 284 and 285:
WARWICK TRIANGLE: A fragile public-
- Page 286 and 287:
Arguably, the primary constraint pr
- Page 288 and 289:
Figure 8.1: The quadruple helix - t
- Page 290 and 291:
• Completing the National Framewo
- Page 292 and 293:
development agency) that took place
- Page 294 and 295:
MILE’s strategic objectives are:
- Page 296 and 297:
Public participation should be the
- Page 298 and 299:
The implementation of CBP through t
- Page 300 and 301:
According to Cloete (2015) a partne
- Page 302 and 303:
The chapters in this State of Citie
- Page 304 and 305:
Overall Recommendations Urban space
- Page 306 and 307:
Ensuring city transformation throug
- Page 308 and 309:
Roadmap to the city dashboards All
- Page 311 and 312:
Buffalo City @refinedrevolt
- Page 313 and 314:
CITY FINANCE economy Municipal reve
- Page 315 and 316:
Overview of flagship programme The
- Page 317:
Reflections While the development o
- Page 320 and 321:
People and Households Size of city
- Page 322 and 323:
Design Capital Introduction Cities
- Page 324 and 325:
Manenberg Contact centre Source: P.
- Page 327 and 328:
City of Ekurhuleni @moography
- Page 329 and 330:
100% 80% 60% 40% 20% 0% CITY FINANC
- Page 331 and 332:
Overview of flagship programme Situ
- Page 333:
the corporate structure and governa
- Page 336 and 337:
People and Households Size of city
- Page 338 and 339:
Go!Durban Introduction Integrated p
- Page 340 and 341:
Go!Durban will include new railways
- Page 343 and 344:
City of JOHANNESBURG @jayjay_gregor
- Page 345 and 346:
100% 80% 60% 40% 20% 0% CITY FINANC
- Page 347 and 348:
Overview of flagship programme The
- Page 349:
However, the success of the Corrido
- Page 352 and 353:
People and Households Size of city
- Page 354 and 355:
Naval Hill Introduction Heritage is
- Page 356 and 357:
In December 2012, the redevelopment
- Page 359 and 360:
Msunduzi @natesvw
- Page 361 and 362:
100% 80% 60% 40% 20% CITY FINANCE e
- Page 363 and 364:
important tourist sites, there have
- Page 365:
In addition, the PURP includes the
- Page 368 and 369:
People and Households Size of city
- Page 370 and 371:
Safety and Peace through Urban Upgr
- Page 372 and 373:
A number of other projects have tak
- Page 375 and 376:
City of Tshwane @drae_savvides
- Page 377 and 378:
100% 80% 60% 40% 20% 0% CITY FINANC
- Page 379 and 380:
Wi-Fi is a significant enabler that
- Page 381:
The coverage map below shows the pl
- Page 384 and 385:
Introduction A key part of the deve
- Page 386 and 387:
These indicators were evaluated on
- Page 388 and 389:
SCODA is a partnership between citi
- Page 390 and 391:
Indicator PRODUCTIVE CITIES Definit
- Page 392 and 393:
Indicator SUSTAINABLE CITIES Defini
- Page 394 and 395:
2016 State of Cities Report Spatial
- Page 396 and 397:
Acronyms ACSA Airports Company Sout
- Page 398 and 399:
FIGURES Figure 1.1 State of South A
- Page 400 and 401:
. . . Figure 6.7 Percentage of seni
- Page 402 and 403:
References for Chapter 1 AfDB (Afri
- Page 404 and 405:
FFC (Financial Fiscal Commission).
- Page 406 and 407:
Cameron B. 2009. Integrated Rapid P
- Page 408 and 409:
References for Chapter 4 Balbo M. a
- Page 410 and 411:
Venter C and Cross C. 2014. Access
- Page 412 and 413:
DPME (Department of Planning and Mo
- Page 414 and 415:
National Treasury. 2006. Local Gove
- Page 416:
Tel: + 27 11 407 6471 • Fax: + 27


