cities
SoCR16-Main-Report-online
SoCR16-Main-Report-online
You also want an ePaper? Increase the reach of your titles
YUMPU automatically turns print PDFs into web optimized ePapers that Google loves.
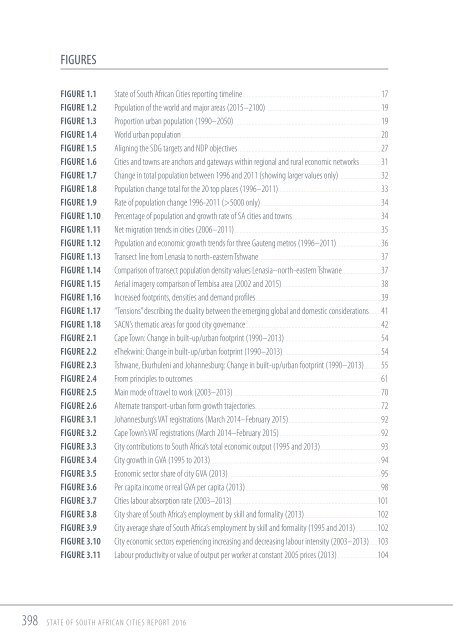
FIGURES<br />
Figure 1.1 State of South African Cities reporting timeline. .............................................................................................17<br />
Figure 1.2 Population of the world and major areas (2015–2100) .............................................................................19<br />
Figure 1.3 Proportion urban population (1990–2050). ...................................................................................................19<br />
Figure 1.4 World urban population .......................................................................................................................................20<br />
Figure 1.5 Aligning the SDG targets and NDP objectives ................................................................................................27<br />
Figure 1.6 Cities and towns are anchors and gateways within regional and rural economic networks ...............31<br />
Figure 1.7 Change in total population between 1996 and 2011 (showing larger values only). ............................32<br />
Figure 1.8 Population change total for the 20 top places (1996–2011). .....................................................................33<br />
Figure 1.9 Rate of population change 1996-2011 (>5000 only). .................................................................................34<br />
Figure 1.10 Percentage of population and growth rate of SA <strong>cities</strong> and towns. ............................................................34<br />
Figure 1.11 Net migration trends in <strong>cities</strong> (2006–2011). ...................................................................................................35<br />
Figure 1.12 Population and economic growth trends for three Gauteng metros (1996–2011). ..............................36<br />
Figure 1.13 Transect line from Lenasia to north-eastern Tshwane. ..................................................................................37<br />
Figure 1.14 Comparison of transect population density values Lenasia–north-eastern Tshwane. ..........................37<br />
Figure 1.15 Aerial imagery comparison of Tembisa area (2002 and 2015). ...................................................................38<br />
Figure 1.16 Increased footprints, densities and demand profiles. ....................................................................................39<br />
Figure 1.17 “Tensions” describing the duality between the emerging global and domestic considerations. ........41<br />
Figure 1.18 SACN’s thematic areas for good city governance. ...........................................................................................42<br />
Figure 2.1 Cape Town: Change in built-up/urban footprint (1990–2013). .................................................................54<br />
Figure 2.2 eThekwini: Change in built-up/urban footprint (1990–2013). ..................................................................54<br />
Figure 2.3 Tshwane, Ekurhuleni and Johannesburg: Change in built-up/urban footprint (1990–2013). ...........55<br />
Figure 2.4 From principles to outcomes ...............................................................................................................................61<br />
Figure 2.5 Main mode of travel to work (2003–2013) ....................................................................................................70<br />
Figure 2.6 Alternate transport-urban form growth trajectories. . . . . . . . . . . . . . . . . . . . . . . . . . . . . . . . . . . . . . . . . . . . . . . . . . . . . . . . . . . . . . . . . . . . . . . . . . . . . . . . . . . . . 72<br />
Figure 3.1 Johannesburg’s VAT registrations (March 2014–February 2015). ..............................................................92<br />
Figure 3.2 Cape Town’s VAT registrations (March 2014–February 2015) .....................................................................92<br />
Figure 3.3 City contributions to South Africa’s total economic output (1995 and 2013). . . . . . . . . . . . . . . . . . . . . . . . . . . . . . . . . . . . . . . . . 93<br />
Figure 3.4 City growth in GVA (1995 to 2013). ...................................................................................................................94<br />
Figure 3.5 Economic sector share of city GVA (2013)........................................................................................................95<br />
Figure 3.6 Per capita income or real GVA per capita (2013). ...........................................................................................98<br />
Figure 3.7 Cities labour absorption rate (2003–2013). ................................................................................................. 101<br />
Figure 3.8 City share of South Africa’s employment by skill and formality (2013) ................................................. 102<br />
Figure 3.9 City average share of South Africa’s employment by skill and formality (1995 and 2013). .............. 102<br />
Figure 3.10 City economic sectors experiencing increasing and decreasing labour intensity (2003–2013). ..... 103<br />
Figure 3.11 Labour productivity or value of output per worker at constant 2005 prices (2013). .......................... 104<br />
398 State of South African Cities Report 2016


