cities
SoCR16-Main-Report-online
SoCR16-Main-Report-online
You also want an ePaper? Increase the reach of your titles
YUMPU automatically turns print PDFs into web optimized ePapers that Google loves.
.<br />
.<br />
.<br />
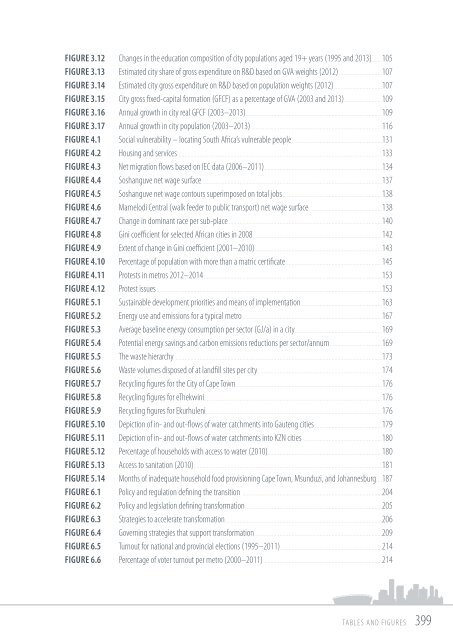
Figure 3.12 Changes in the education composition of city populations aged 19+ years (1995 and 2013). ...... 105<br />
Figure 3.13 Estimated city share of gross expenditure on R&D based on GVA weights (2012). ............................ 107<br />
Figure 3.14 Estimated city gross expenditure on R&D based on population weights (2012) ................................ 107<br />
Figure 3.15 City gross fixed-capital formation (GFCF) as a percentage of GVA (2003 and 2013) ......................... 109<br />
Figure 3.16 Annual growth in city real GFCF (2003–2013). ........................................................................................... 109<br />
Figure 3.17 Annual growth in city population (2003–2013) ........................................................................................ 116<br />
Figure 4.1 Social vulnerability – locating South Africa’s vulnerable people. ............................................................ 131<br />
Figure 4.2 Housing and services ........................................................................................................................................ 133<br />
Figure 4.3 Net migration flows based on IEC data (2006–2011). .............................................................................. 134<br />
Figure 4.4 Soshanguve net wage surface. ......................................................................................................................... 137<br />
Figure 4.5 Soshanguve net wage contours superimposed on total jobs. .................................................................. 138<br />
Figure 4.6 Mamelodi Central (walk feeder to public transport) net wage surface ................................................. 138<br />
Figure 4.7 Change in dominant race per sub-place . ...................................................................................................... 140<br />
Figure 4.8 Gini coefficient for selected African <strong>cities</strong> in 2008. ...................................................................................... 142<br />
Figure 4.9 Extent of change in Gini coefficient (2001–2010). ..................................................................................... 143<br />
Figure 4.10 Percentage of population with more than a matric certificate. ................................................................ 145<br />
Figure 4.11 Protests in metros 2012–2014 ........................................................................................................................ 153<br />
Figure 4.12 Protest issues. ....................................................................................................................................................... 153<br />
Figure 5.1 Sustainable development priorities and means of implementation. ...................................................... 163<br />
Figure 5.2 Energy use and emissions for a typical metro ............................................................................................. 167<br />
Figure 5.3 Average baseline energy consumption per sector (GJ/a) in a city. .......................................................... 169<br />
Figure 5.4 Potential energy savings and carbon emissions reductions per sector/annum. .................................. 169<br />
Figure 5.5 The waste hierarchy. ........................................................................................................................................... 173<br />
Figure 5.6 Waste volumes disposed of at landfill sites per city.................................................................................... 174<br />
Figure 5.7 Recycling figures for the City of Cape Town. .................................................................................................. 176<br />
Figure 5.8 Recycling figures for eThekwini. ....................................................................................................................... 176<br />
Figure 5.9 Recycling figures for Ekurhuleni. ...................................................................................................................... 176<br />
Figure 5.10 Depiction of in- and out-flows of water catchments into Gauteng <strong>cities</strong> . ............................................ 179<br />
Figure 5.11 Depiction of in- and out-flows of water catchments into KZN <strong>cities</strong> .................................................... 180<br />
Figure 5.12 Percentage of households with access to water (2010). ............................................................................ 180<br />
Figure 5.13 Access to sanitation (2010). .............................................................................................................................. 181<br />
Figure 5.14 Months of inadequate household food provisioning Cape Town, Msunduzi, and Johannesburg. ... 187<br />
Figure 6.1 Policy and regulation defining the transition .............................................................................................. 204<br />
Figure 6.2 Policy and legislation defining transformation ............................................................................................ 205<br />
Figure 6.3 Strategies to accelerate transformation. ......................................................................................................... 206<br />
Figure 6.4 Governing strategies that support transformation. ..................................................................................... 209<br />
Figure 6.5 Turnout for national and provincial elections (1995–2011) .................................................................... 214<br />
Figure 6.6 Percentage of voter turnout per metro (2000–2011) .............................................................................. 214<br />
TABLES AND FIGURES 399


