MAPPING CULTURE
Mapping-Culture-Venues-and-Infrastructure-in-the-City-of-Sydney
Mapping-Culture-Venues-and-Infrastructure-in-the-City-of-Sydney

You also want an ePaper? Increase the reach of your titles
YUMPU automatically turns print PDFs into web optimized ePapers that Google loves.
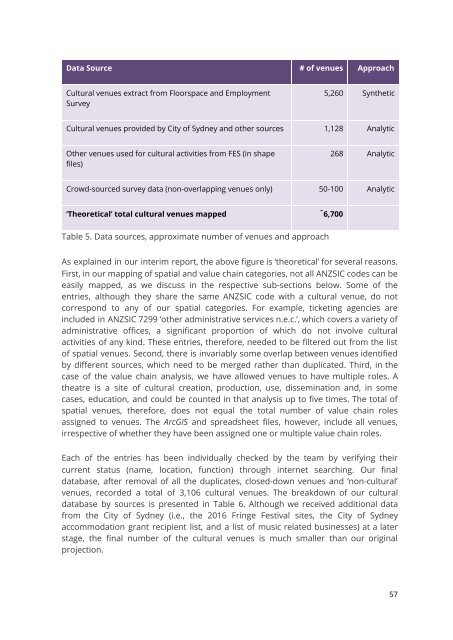
Data Source # of venues Approach<br />
Cultural venues extract from Floorspace and Employment<br />
Survey<br />
5,260 Synthetic<br />
Cultural venues provided by City of Sydney and other sources 1,128 Analytic<br />
Other venues used for cultural activities from FES (in shape<br />
files)<br />
268 Analytic<br />
Crowd-sourced survey data (non-overlapping venues only) 50-100 Analytic<br />
‘Theoretical’ total cultural venues mapped ̃6,700<br />
Table 5. Data sources, approximate number of venues and approach<br />
As explained in our interim report, the above figure is ‘theoretical’ for several reasons.<br />
First, in our mapping of spatial and value chain categories, not all ANZSIC codes can be<br />
easily mapped, as we discuss in the respective sub-sections below. Some of the<br />
entries, although they share the same ANZSIC code with a cultural venue, do not<br />
correspond to any of our spatial categories. For example, ticketing agencies are<br />
included in ANZSIC 7299 ‘other administrative services n.e.c.’, which covers a variety of<br />
administrative offices, a significant proportion of which do not involve cultural<br />
activities of any kind. These entries, therefore, needed to be filtered out from the list<br />
of spatial venues. Second, there is invariably some overlap between venues identified<br />
by different sources, which need to be merged rather than duplicated. Third, in the<br />
case of the value chain analysis, we have allowed venues to have multiple roles. A<br />
theatre is a site of cultural creation, production, use, dissemination and, in some<br />
cases, education, and could be counted in that analysis up to five times. The total of<br />
spatial venues, therefore, does not equal the total number of value chain roles<br />
assigned to venues. The ArcGIS and spreadsheet files, however, include all venues,<br />
irrespective of whether they have been assigned one or multiple value chain roles.<br />
Each of the entries has been individually checked by the team by verifying their<br />
current status (name, location, function) through internet searching. Our final<br />
database, after removal of all the duplicates, closed-down venues and ‘non-cultural’<br />
venues, recorded a total of 3,106 cultural venues. The breakdown of our cultural<br />
database by sources is presented in Table 6. Although we received additional data<br />
from the City of Sydney (i.e., the 2016 Fringe Festival sites, the City of Sydney<br />
accommodation grant recipient list, and a list of music related businesses) at a later<br />
stage, the final number of the cultural venues is much smaller than our original<br />
projection.<br />
57