MAPPING CULTURE
Mapping-Culture-Venues-and-Infrastructure-in-the-City-of-Sydney
Mapping-Culture-Venues-and-Infrastructure-in-the-City-of-Sydney

Create successful ePaper yourself
Turn your PDF publications into a flip-book with our unique Google optimized e-Paper software.
5.3 Mapping of cultural venues by value chain role—all<br />
villages<br />
We experienced difficulty when mapping venues by value chain role, in part because a<br />
given venue’s primary industry is often not conspicuously related to the roles of<br />
creation, production, dissemination, use or education in the value chain. Another<br />
related problem is the lack of specificity of ANZSIC codes. For example, in ANZSIC 6940<br />
(advertising services), there is no clear indication from the ANZSIC code whether an<br />
advertising company engages in concept design (creation), produces advertising<br />
materials (e.g., a TV commercial) (production), or conducts an advertising campaign<br />
(dissemination) alone, or is engaged in some or all of these activities. Consequently,<br />
the research team had to check each venue (mostly through desktop online searching<br />
and analysis of official websites or facebook pages) and manually assign these value<br />
chain roles to each venue.<br />
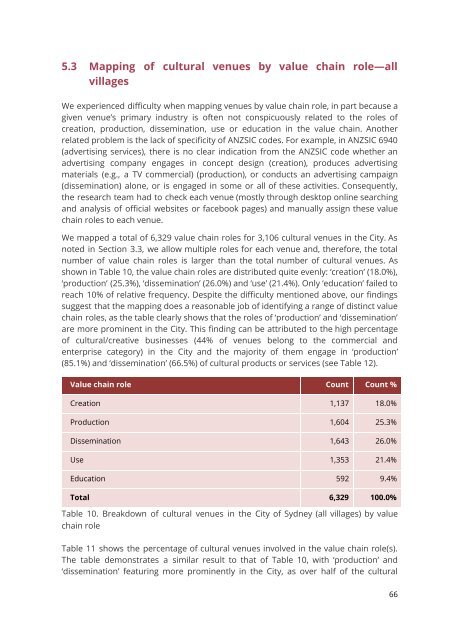
We mapped a total of 6,329 value chain roles for 3,106 cultural venues in the City. As<br />
noted in Section 3.3, we allow multiple roles for each venue and, therefore, the total<br />
number of value chain roles is larger than the total number of cultural venues. As<br />
shown in Table 10, the value chain roles are distributed quite evenly: ‘creation’ (18.0%),<br />
‘production’ (25.3%), ‘dissemination’ (26.0%) and ‘use’ (21.4%). Only ‘education’ failed to<br />
reach 10% of relative frequency. Despite the difficulty mentioned above, our findings<br />
suggest that the mapping does a reasonable job of identifying a range of distinct value<br />
chain roles, as the table clearly shows that the roles of ‘production’ and ‘dissemination’<br />
are more prominent in the City. This finding can be attributed to the high percentage<br />
of cultural/creative businesses (44% of venues belong to the commercial and<br />
enterprise category) in the City and the majority of them engage in ‘production’<br />
(85.1%) and ‘dissemination’ (66.5%) of cultural products or services (see Table 12).<br />
Value chain role Count Count %<br />
Creation 1,137 18.0%<br />
Production 1,604 25.3%<br />
Dissemination 1,643 26.0%<br />
Use 1,353 21.4%<br />
Education 592 9.4%<br />
Total 6,329 100.0%<br />
Table 10. Breakdown of cultural venues in the City of Sydney (all villages) by value<br />
chain role<br />
Table 11 shows the percentage of cultural venues involved in the value chain role(s).<br />
The table demonstrates a similar result to that of Table 10, with ‘production’ and<br />
‘dissemination’ featuring more prominently in the City, as over half of the cultural<br />
66