MAPPING CULTURE
Mapping-Culture-Venues-and-Infrastructure-in-the-City-of-Sydney
Mapping-Culture-Venues-and-Infrastructure-in-the-City-of-Sydney

Create successful ePaper yourself
Turn your PDF publications into a flip-book with our unique Google optimized e-Paper software.
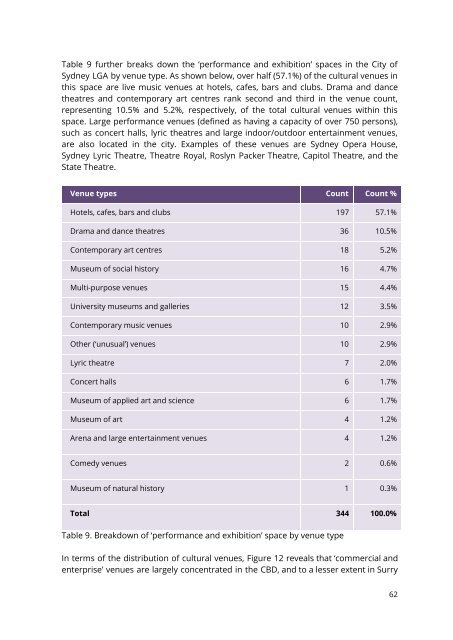
Table 9 further breaks down the ‘performance and exhibition’ spaces in the City of<br />
Sydney LGA by venue type. As shown below, over half (57.1%) of the cultural venues in<br />
this space are live music venues at hotels, cafes, bars and clubs. Drama and dance<br />
theatres and contemporary art centres rank second and third in the venue count,<br />
representing 10.5% and 5.2%, respectively, of the total cultural venues within this<br />
space. Large performance venues (defined as having a capacity of over 750 persons),<br />
such as concert halls, lyric theatres and large indoor/outdoor entertainment venues,<br />
are also located in the city. Examples of these venues are Sydney Opera House,<br />
Sydney Lyric Theatre, Theatre Royal, Roslyn Packer Theatre, Capitol Theatre, and the<br />
State Theatre.<br />
Venue types Count Count %<br />
Hotels, cafes, bars and clubs 197 57.1%<br />
Drama and dance theatres 36 10.5%<br />
Contemporary art centres 18 5.2%<br />
Museum of social history 16 4.7%<br />
Multi-purpose venues 15 4.4%<br />
University museums and galleries 12 3.5%<br />
Contemporary music venues 10 2.9%<br />
Other (‘unusual’) venues 10 2.9%<br />
Lyric theatre 7 2.0%<br />
Concert halls 6 1.7%<br />
Museum of applied art and science 6 1.7%<br />
Museum of art 4 1.2%<br />
Arena and large entertainment venues 4 1.2%<br />
Comedy venues 2 0.6%<br />
Museum of natural history 1 0.3%<br />
Total 344 100.0%<br />
Table 9. Breakdown of ‘performance and exhibition’ space by venue type<br />
In terms of the distribution of cultural venues, Figure 12 reveals that ‘commercial and<br />
enterprise’ venues are largely concentrated in the CBD, and to a lesser extent in Surry<br />
62