MAPPING CULTURE
Mapping-Culture-Venues-and-Infrastructure-in-the-City-of-Sydney
Mapping-Culture-Venues-and-Infrastructure-in-the-City-of-Sydney

You also want an ePaper? Increase the reach of your titles
YUMPU automatically turns print PDFs into web optimized ePapers that Google loves.
Education 2 0.7%<br />
Total 293 100.0%<br />
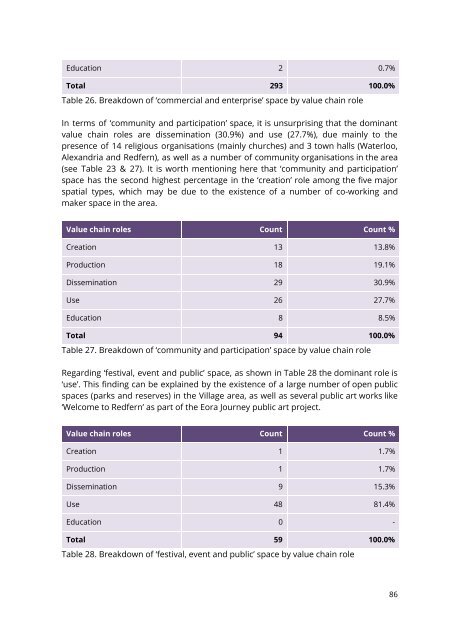
Table 26. Breakdown of ‘commercial and enterprise’ space by value chain role<br />
In terms of ‘community and participation’ space, it is unsurprising that the dominant<br />
value chain roles are dissemination (30.9%) and use (27.7%), due mainly to the<br />
presence of 14 religious organisations (mainly churches) and 3 town halls (Waterloo,<br />
Alexandria and Redfern), as well as a number of community organisations in the area<br />
(see Table 23 & 27). It is worth mentioning here that ‘community and participation’<br />
space has the second highest percentage in the ‘creation’ role among the five major<br />
spatial types, which may be due to the existence of a number of co-working and<br />
maker space in the area.<br />
Value chain roles Count Count %<br />
Creation 13 13.8%<br />
Production 18 19.1%<br />
Dissemination 29 30.9%<br />
Use 26 27.7%<br />
Education 8 8.5%<br />
Total 94 100.0%<br />
Table 27. Breakdown of ‘community and participation’ space by value chain role<br />
Regarding ‘festival, event and public’ space, as shown in Table 28 the dominant role is<br />
‘use’. This finding can be explained by the existence of a large number of open public<br />
spaces (parks and reserves) in the Village area, as well as several public art works like<br />
‘Welcome to Redfern’ as part of the Eora Journey public art project.<br />
Value chain roles Count Count %<br />
Creation 1 1.7%<br />
Production 1 1.7%<br />
Dissemination 9 15.3%<br />
Use 48 81.4%<br />
Education 0 -<br />
Total 59 100.0%<br />
Table 28. Breakdown of ‘festival, event and public’ space by value chain role<br />
86