Mathematics for Computer Science
e9ck2Ar
e9ck2Ar

Create successful ePaper yourself
Turn your PDF publications into a flip-book with our unique Google optimized e-Paper software.
“mcs” — 2017/3/3 — 11:21 — page 755 — #763<br />
18.4. Why Tree Diagrams Work 755<br />
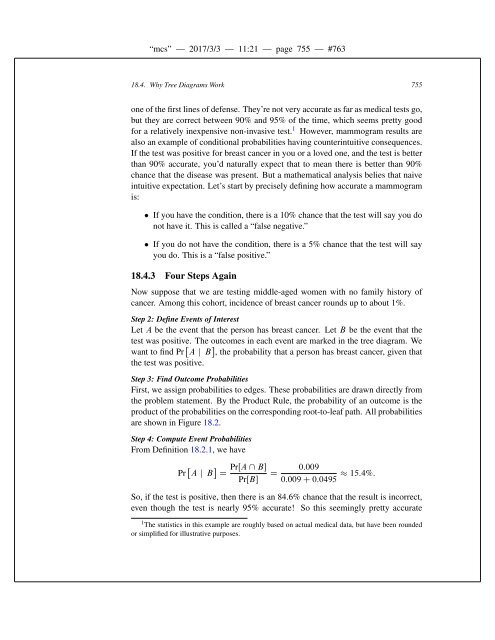
one of the first lines of defense. They’re not very accurate as far as medical tests go,<br />
but they are correct between 90% and 95% of the time, which seems pretty good<br />
<strong>for</strong> a relatively inexpensive non-invasive test. 1 However, mammogram results are<br />
also an example of conditional probabilities having counterintuitive consequences.<br />
If the test was positive <strong>for</strong> breast cancer in you or a loved one, and the test is better<br />
than 90% accurate, you’d naturally expect that to mean there is better than 90%<br />
chance that the disease was present. But a mathematical analysis belies that naive<br />
intuitive expectation. Let’s start by precisely defining how accurate a mammogram<br />
is:<br />
If you have the condition, there is a 10% chance that the test will say you do<br />
not have it. This is called a “false negative.”<br />
If you do not have the condition, there is a 5% chance that the test will say<br />
you do. This is a “false positive.”<br />
18.4.3 Four Steps Again<br />
Now suppose that we are testing middle-aged women with no family history of<br />
cancer. Among this cohort, incidence of breast cancer rounds up to about 1%.<br />
Step 2: Define Events of Interest<br />
Let A be the event that the person has breast cancer. Let B be the event that the<br />
test was positive. The outcomes in each event are marked in the tree diagram. We<br />
want to find Pr A j B , the probability that a person has breast cancer, given that<br />
the test was positive.<br />
Step 3: Find Outcome Probabilities<br />
First, we assign probabilities to edges. These probabilities are drawn directly from<br />
the problem statement. By the Product Rule, the probability of an outcome is the<br />
product of the probabilities on the corresponding root-to-leaf path. All probabilities<br />
are shown in Figure 18.2.<br />
Step 4: Compute Event Probabilities<br />
From Definition 18.2.1, we have<br />
Pr A j B D<br />
PrŒA \ B<br />
PrŒB<br />
D<br />
0:009<br />
0:009 C 0:0495 15:4%:<br />
So, if the test is positive, then there is an 84.6% chance that the result is incorrect,<br />
even though the test is nearly 95% accurate! So this seemingly pretty accurate<br />
1 The statistics in this example are roughly based on actual medical data, but have been rounded<br />
or simplified <strong>for</strong> illustrative purposes.