
Create successful ePaper yourself
Turn your PDF publications into a flip-book with our unique Google optimized e-Paper software.
GLOBAL INVESTOR 2.07 Basics — 21<br />
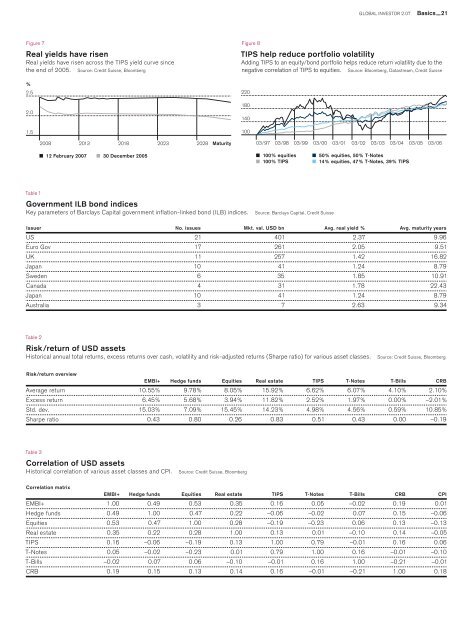
Figure 7<br />
Real yields have risen<br />
Real yields have risen across the TIPS yield curve since<br />
the end of 2005. Source: Credit Suisse, Bloomberg<br />
%<br />
2.5<br />
2.0<br />
1.5<br />
Figure 8<br />
TIPS help reduce portfolio volatility<br />
Adding TIPS to an equity/bond portfolio helps reduce return volatility due to the<br />
negative correlation of TIPS to equities. Source: Bloomberg, Datastream, Credit Suisse<br />
220<br />
180<br />
140<br />
100<br />
2008 2013 2018<br />
2023 2028<br />
Maturity 03/97 03/98 03/99 03/00 03/01 03/02 03/03 03/04 03/05 03/06<br />
12 February 2007<br />
30 December 2005<br />
100% equities<br />
100% TIPS<br />
50% equities, 50% T-Notes<br />
14% equities, 47% T-Notes, 39% TIPS<br />
Table 1<br />
Government ILB bond indices<br />
Key parameters of Barclays Capital government inflation-linked bond (ILB) indices.<br />
Source: Barclays Capital, Credit Suisse<br />
Issuer No. issues Mkt. val. USD bn Avg. real yield % Avg. maturity years<br />
US 21 401 2.37 9.96<br />
Euro Gov 17 261 2.05 9.51<br />
UK 11 257 1.42 16.82<br />
Japan 10 41 1.24 8.79<br />
Sweden 6 35 1.85 10.91<br />
Canada 4 31 1.78 22.43<br />
Japan 10 41 1.24 8.79<br />
Australia 3 7 2.63 9.34<br />
Table 2<br />
Risk/return of USD assets<br />
Historical annual total returns, excess returns over cash, volatility and risk-adjusted returns (Sharpe ratio) for various asset classes.<br />
Source: Credit Suisse, Bloomberg<br />
Risk/return overview<br />
EMBI+ Hedge funds Equities Real estate TIPS T-Notes T-Bills CRB<br />
Average return 10.55% 9.78% 8.05% 15.92% 6.62% 6.07% 4.10% 2.10%<br />
Excess return 6.45% 5.68% 3.94% 11.82% 2.52% 1.97% 0.00% –2.01%<br />
Std. dev. 15.03% 7.09% 15.45% 14.23% 4.98% 4.56% 0.59% 10.85%<br />
Sharpe ratio 0.43 0.80 0.26 0.83 0.51 0.43 0.00 –0.19<br />
Table 3<br />
Correlation of USD assets<br />
Historical correlation of various asset classes and CPI.<br />
Source: Credit Suisse, Bloomberg<br />
Correlation matrix<br />
EMBI+ Hedge funds Equities Real estate TIPS T-Notes T-Bills CRB CPI<br />
EMBI+ 1.00 0.49 0.53 0.35 0.16 0.05 –0.02 0.19 0.01<br />
Hedge funds 0.49 1.00 0.47 0.22 –0.06 –0.02 0.07 0.15 –0.06<br />
Equities 0.53 0.47 1.00 0.28 –0.19 –0.23 0.06 0.13 –0.13<br />
Real estate 0.35 0.22 0.28 1.00 0.13 0.01 –0.10 0.14 –0.05<br />
TIPS 0.16 –0.06 –0.19 0.13 1.00 0.79 –0.01 0.16 0.06<br />
T-Notes 0.05 –0.02 –0.23 0.01 0.79 1.00 0.16 –0.01 –0.10<br />
T-Bills –0.02 0.07 0.06 –0.10 –0.01 0.16 1.00 –0.21 –0.01<br />
CRB 0.19 0.15 0.13 0.14 0.16 –0.01 –0.21 1.00 0.18