

RUT240_manual_v1_9

You also want an ePaper? Increase the reach of your titles
YUMPU automatically turns print PDFs into web optimized ePapers that Google loves.
6.7.3 Realtime Traffic<br />
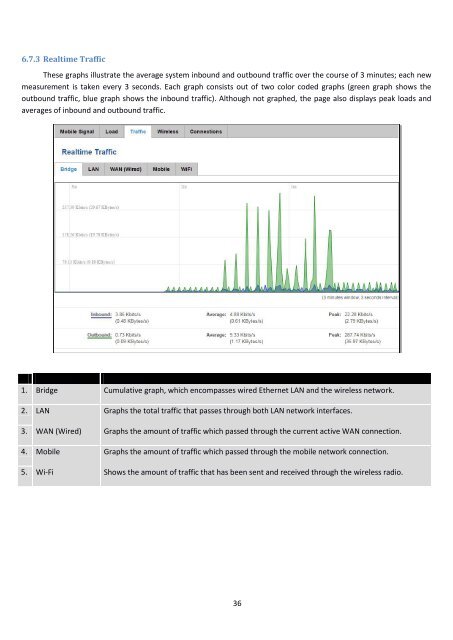
These graphs illustrate the average system inbound and outbound traffic over the course of 3 minutes; each new<br />
measurement is taken every 3 seconds. Each graph consists out of two color coded graphs (green graph shows the<br />
outbound traffic, blue graph shows the inbound traffic). Although not graphed, the page also displays peak loads and<br />
averages of inbound and outbound traffic.<br />
Field Name Explanation<br />
1. Bridge Cumulative graph, which encompasses wired Ethernet LAN and the wireless network.<br />
2. LAN Graphs the total traffic that passes through both LAN network interfaces.<br />
3. WAN (Wired) Graphs the amount of traffic which passed through the current active WAN connection.<br />
4. Mobile Graphs the amount of traffic which passed through the mobile network connection.<br />
5. Wi-Fi Shows the amount of traffic that has been sent and received through the wireless radio.<br />
36