Abacus Property Group – Annual Financial Report 2018

You also want an ePaper? Increase the reach of your titles
YUMPU automatically turns print PDFs into web optimized ePapers that Google loves.
DIRECTORS’ REPORT<br />
30 June <strong>2018</strong><br />
ABACUS PROPERTY GROUP<br />
OPERATING AND FINANCIAL REVIEW (continued)<br />
GROUP RESULTS SUMMARY (continued)<br />
Capital management<br />
The <strong>Abacus</strong> balance sheet remains strong with gearing levels conservative at 23.3%, well within our target<br />
gearing limit of 35%. At 30 June <strong>2018</strong>, <strong>Abacus</strong> had $135 million of available liquidity that provides capacity for<br />
use for up to $211 million of accretive acquisitions. Post year end several asset settlements occurred further<br />
adding to the <strong>Group</strong>’s liquidity balances providing significant opportunity to prudently invest and up weight our<br />
exposure to office and self-storage markets throughout select Australian markets. We view low gearing and high<br />
liquidity levels positively as we extend through, what we consider to be the top of the property markets, with the<br />
ability to take advantage should opportunities arise. We anticipate <strong>Abacus</strong>’ weighted average interest rate will<br />
remain relatively stable as current capacity is utilised and anticipate it should be no greater than 5.0% over the<br />
next year.<br />
CORE SEGMENT RESULTS SUMMARY<br />
Business activities that specifically contributed to the <strong>Abacus</strong>’ operating performance and financial condition for<br />
the financial year were:<br />
<strong>Property</strong> Investment<br />
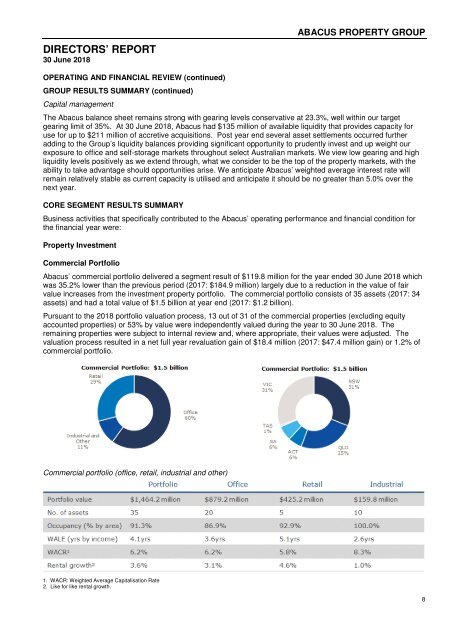
Commercial Portfolio<br />
<strong>Abacus</strong>’ commercial portfolio delivered a segment result of $119.8 million for the year ended 30 June <strong>2018</strong> which<br />
was 35.2% lower than the previous period (2017: $184.9 million) largely due to a reduction in the value of fair<br />
value increases from the investment property portfolio. The commercial portfolio consists of 35 assets (2017: 34<br />
assets) and had a total value of $1.5 billion at year end (2017: $1.2 billion).<br />
Pursuant to the <strong>2018</strong> portfolio valuation process, 13 out of 31 of the commercial properties (excluding equity<br />
accounted properties) or 53% by value were independently valued during the year to 30 June <strong>2018</strong>. The<br />
remaining properties were subject to internal review and, where appropriate, their values were adjusted. The<br />
valuation process resulted in a net full year revaluation gain of $18.4 million (2017: $47.4 million gain) or 1.2% of<br />
commercial portfolio.<br />
Commercial portfolio (office, retail, industrial and other)<br />
1. WACR: Weighted Average Capitalisation Rate<br />
2. Like for like rental growth.<br />
8