Abacus Property Group – Annual Financial Report 2018

You also want an ePaper? Increase the reach of your titles
YUMPU automatically turns print PDFs into web optimized ePapers that Google loves.
ABACUS PROPERTY GROUP<br />
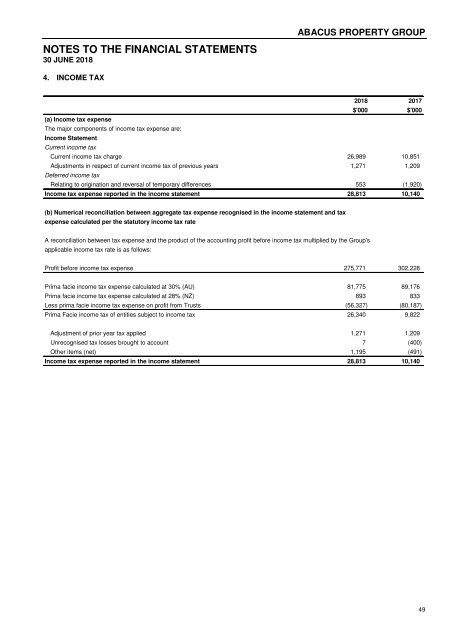
NOTES TO THE FINANCIAL STATEMENTS <strong>–</strong> Segment Information (continued)<br />
30 JUNE <strong>2018</strong><br />
Core Segments<br />
Non Core Segments<br />
<strong>Property</strong> Investments<br />
<strong>Property</strong><br />
Total Core<br />
Commercial Storage Developments Unallocated Segments Other Eliminations Consolidated<br />
Year ended 30 June 2017 $'000 $'000 $'000 $'000 $'000 $'000 $'000 $'000<br />
Revenue<br />
Rental income 71,634 69,687 - - 141,321 9,313 - 150,634<br />
Hotel income - - - - - 30,968 - 30,968<br />
Finance income - - 43,891 - 43,891 4 - 43,895<br />
Management and other fee income 12,620 - - - 12,620 - (7,150) 5,470<br />
Sale of inventory - - - - - 16,192 - 16,192<br />
Net change in fair value of investment properties derecognised 36,775 - - - 36,775 8,492 - 45,267<br />
Net change in fair value of investments and financial instruments<br />
11,534 - - - 11,534 493 (4,860) 7,167<br />
derecognised<br />
Net gain on sale of property, plant & equipment - - - - - 11,077 685 11,762<br />
Net change in investment properties and property, plant & equipment<br />
47,440 27,333 - - 74,773 10,175 - 84,948<br />
held at balance date<br />
Net change in fair value of derivatives - - - 4,317 4,317 141 - 4,458<br />
Share of profit from equity accounted investments ^ 33,557 - 20,716 - 54,273 - - 54,273<br />
Other income 6,102 - 1,057 - 7,159 825 (328) 7,656<br />
Other unallocated revenue - - - 365 365 377 - 742<br />
Total consolidated revenue 219,662 97,020 65,664 4,682 387,028 88,057 (11,653) 463,432<br />
<strong>Property</strong> expenses and outgoings (15,174) (25,939) - - (41,113) (2,665) 301 (43,477)<br />
Hotel expenses - - - - - (23,415) - (23,415)<br />
Depreciation and amortisation expense (1,872) (406) - - (2,278) (203) - (2,481)<br />
Cost of inventory sales - - - - - (13,490) 2,522 (10,968)<br />
Impairment charges - - (3,000) - (3,000) 3,000 - -<br />
Administrative and other expenses (17,754) - (7,609) - (25,363) (1,549) (2,571) (29,483)<br />
Segment result 184,862 70,675 55,055 4,682 315,274 49,735 (11,401) 353,608<br />
Net change in fair value of investments held at balance date (15,537) (28,015) 27,998 (15,554)<br />
Finance costs (32,898) (7,183) 4,255 (35,826)<br />
Profit before tax 266,839 14,537 20,852 302,228<br />
Income tax expense (7,863) (2,277) - (10,140)<br />
Net profit for the year 258,976 12,260 20,852 292,088<br />
less non-controlling interest (1,044) (5,947) - (6,991)<br />
Net profit for the year attributable to members of the <strong>Group</strong><br />
257,932 6,313 20,852 285,097<br />
^ includes fair value gain of $0.7 million<br />
46