Abacus Property Group – Annual Financial Report 2018

Create successful ePaper yourself
Turn your PDF publications into a flip-book with our unique Google optimized e-Paper software.
ABACUS PROPERTY GROUP<br />
DIRECTORS’ REPORT<br />
30 June <strong>2018</strong><br />
OPERATING AND FINANCIAL REVIEW (continued)<br />
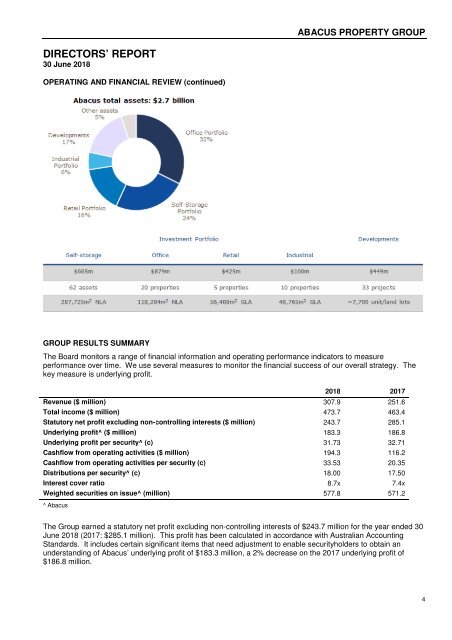
GROUP RESULTS SUMMARY<br />
The Board monitors a range of financial information and operating performance indicators to measure<br />
performance over time. We use several measures to monitor the financial success of our overall strategy. The<br />
key measure is underlying profit.<br />
<strong>2018</strong> 2017<br />
Revenue ($ million) 307.9 251.6<br />
Total income ($ million) 473.7 463.4<br />
Statutory net profit excluding non-controlling interests ($ million) 243.7 285.1<br />
Underlying profit^ ($ million) 183.3 186.8<br />
Underlying profit per security^ (c) 31.73 32.71<br />
Cashflow from operating activities ($ million) 194.3 116.2<br />
Cashflow from operating activities per security (c) 33.53 20.35<br />
Distributions per security^ (c) 18.00 17.50<br />
Interest cover ratio 8.7x 7.4x<br />
Weighted securities on issue^ (million) 577.8 571.2<br />
^ <strong>Abacus</strong><br />
The <strong>Group</strong> earned a statutory net profit excluding non-controlling interests of $243.7 million for the year ended 30<br />
June <strong>2018</strong> (2017: $285.1 million). This profit has been calculated in accordance with Australian Accounting<br />
Standards. It includes certain significant items that need adjustment to enable securityholders to obtain an<br />
understanding of <strong>Abacus</strong>’ underlying profit of $183.3 million, a 2% decrease on the 2017 underlying profit of<br />
$186.8 million.<br />
4