Abacus Property Group – Annual Financial Report 2018

You also want an ePaper? Increase the reach of your titles
YUMPU automatically turns print PDFs into web optimized ePapers that Google loves.
ABACUS PROPERTY GROUP<br />
NOTES TO THE FINANCIAL STATEMENTS<br />
30 JUNE <strong>2018</strong><br />
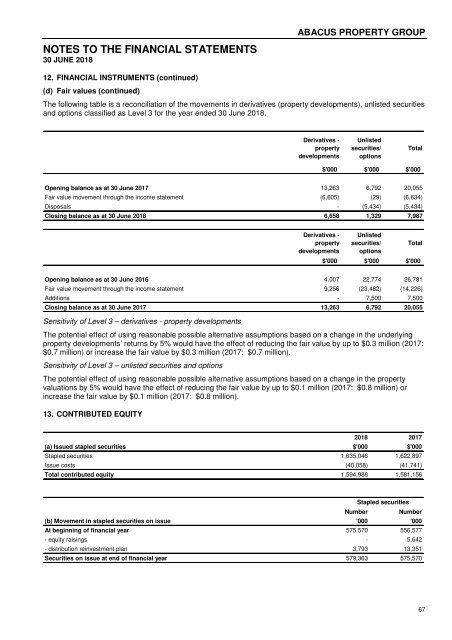
12. FINANCIAL INSTRUMENTS (continued)<br />
(b) Liquidity Risk<br />
Prudent liquidity risk management implies maintaining sufficient cash and marketable securities, the availability of<br />
funding through an adequate and diverse amount of committed credit facilities, the ability to close out market<br />
positions and the flexibility to raise funds through the issue of new stapled securities or the distribution<br />
reinvestment plan.<br />
The <strong>Group</strong>’s policy is to maintain an available loan facility with banks sufficient to meet expected operational<br />
expenses and to finance investment acquisitions for a period of 90 days, including the servicing of financial<br />
obligations. Current loan facilities are assessed and extended for a maximum period based on the <strong>Group</strong>’s<br />
expectations of future interest and market conditions.<br />
The table below shows an analysis of the contractual maturities of key liabilities which forms part of the <strong>Group</strong>’s<br />
assessment of liquidity risk.<br />
Carrying<br />
Amount<br />
Contractual<br />
cash flows<br />
1 Year or<br />
less<br />
Over 1 year<br />
to 5 years<br />
Over<br />
5 years<br />
30 June <strong>2018</strong> $'000 $'000 $'000 $'000 $'000<br />
Liabilities<br />
Trade and other payables 88,568 88,568 88,568 - -<br />
Interest bearing loans and borrowings incl derivatives# 745,415 863,123 73,285 503,225 286,613<br />
Total liabilities 833,983 951,691 161,853 503,225 286,613<br />
Carrying<br />
Amount<br />
Contractual<br />
cash flows<br />
1 Year or<br />
less<br />
Over 1 year<br />
to 5 years<br />
Over<br />
5 years<br />
30 June 2017 $'000 $'000 $'000 $'000 $'000<br />
Liabilities<br />
Trade and other payables 27,865 27,865 27,865 - -<br />
Interest bearing loans and borrowings incl derivatives# 571,467 655,906 32,704 493,132 130,070<br />
Total liabilities 599,332 683,771 60,569 493,132 130,070<br />
# Carrying amount includes fair value of derivative liabilities. Contractual cash flows includes contracted debt and net swap payments using<br />
prevailing forward rates<br />
(c) Market Risk<br />
Market risk is the risk that changes in market prices, such as foreign exchange rates, interest rates and equity<br />
prices will affect the <strong>Group</strong>’s income or the value of its holdings of financial instruments. The objective of market<br />
risk management is to manage and control market risk exposures within acceptable parameters, while optimising<br />
the return.<br />
Interest rate risk / Fair value interest rate risk<br />
The <strong>Group</strong>’s exposure to the risk of changes in market interest rates relates primarily to its long-term bank debt<br />
obligations which are based on floating interest rates. The <strong>Group</strong> has a policy to maintain a mix of floating<br />
exposure and fixed interest rate hedging with fixed rate cover highest in years 1 to 5.<br />
The <strong>Group</strong> hedges to minimise interest rate risk by entering variable to fixed interest rate swaps which also helps<br />
deliver interest covenant compliance and positive carry (net rental income in excess of interest expense) on the<br />
property portfolio. Interest rate swaps have the economic effect of converting borrowings from variable rates to<br />
fixed rates. Under the interest rate swaps, the <strong>Group</strong> agrees to exchange, at specified intervals, the difference<br />
between fixed and variable rate interest amounts calculated by reference to the agreed notional principal<br />
amounts. At 30 June <strong>2018</strong>, after taking into account the effect of interest rate swaps, approximately 41.7% (2017:<br />
48.6%) of the <strong>Group</strong>’s drawn debt is subject to fixed rate hedges. Hedge cover as a percentage of available<br />
facilities at 30 June <strong>2018</strong> is 32.6% (2017: 28.6%). As the <strong>Group</strong> holds interest rate swaps against its variable rate<br />
debt there is a risk that the economic value of a financial instrument will fluctuate because of changes in market<br />
interest rates.<br />
62