Asian Sky Quarterly 2020Q4

Create successful ePaper yourself
Turn your PDF publications into a flip-book with our unique Google optimized e-Paper software.
MARKET DYNAMICS<br />
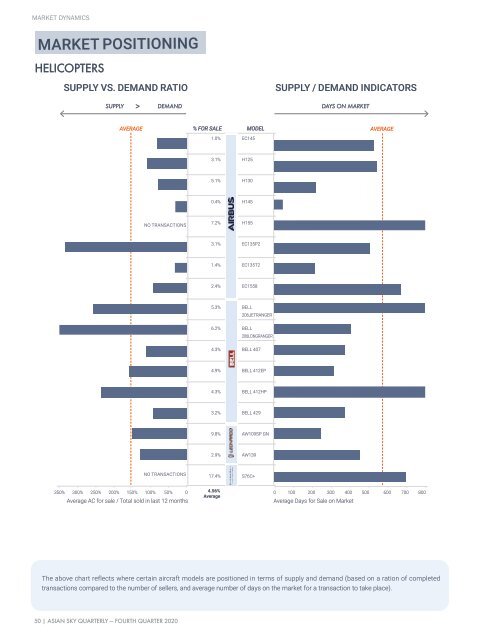
MARKET POSITIONING<br />
HELICOPTERS<br />
SUPPLY VS. DEMAND RATIO<br />
SUPPLY / DEMAND INDICATORS<br />
SUPPLY<br />
> DEMAND<br />
DAYS ON MARKET<br />
AVERAGE<br />
% FOR SALE MODEL<br />
1.0%<br />
EC145<br />
AVERAGE<br />
3.1%<br />
H125<br />
5.1%<br />
H130<br />
0.4%<br />
H145<br />
NO TRANSACTIONS<br />
7.2%<br />
H155<br />
NO TRANSACTIONS<br />
3.1%<br />
EC135P2<br />
1.4%<br />
EC135T2<br />
2.4%<br />
EC1558<br />
5.3%<br />
BELL<br />
206JETRANGER<br />
6.2%<br />
BELL<br />
206LONGRANGER<br />
4.3%<br />
BELL 407<br />
4.9%<br />
BELL 412EP<br />
4.3%<br />
BELL 412HP<br />
3.2%<br />
BELL 429<br />
9.8%<br />
AW109SP GN<br />
2.9%<br />
AW139<br />
NO TRANSACTIONS<br />
17.4%<br />
S76C+<br />
350% 300% 250% 200% 150% 100% 50% 0<br />
Average AC for sale / Total sold in last 12 months<br />
4.56%<br />
Average<br />
0 100 200 300 400 500<br />
Average Days for Sale on Market<br />
600 700 800<br />
The above chart reflects where certain aircraft models are positioned in terms of supply and demand (based on a ration of completed<br />
transactions compared to the number of sellers, and average number of days on the market for a transaction to take place).<br />
50 | ASIAN SKY QUARTERLY — FOURTH QUARTER 2020