

An Interactive Introduction to Organismal and Molecular Biology, 2021
An Interactive Introduction to Organismal and Molecular Biology, 2021
An Interactive Introduction to Organismal and Molecular Biology, 2021

Create successful ePaper yourself
Turn your PDF publications into a flip-book with our unique Google optimized e-Paper software.
Past Climate<br />
CLIMATE CHANGE | 73<br />
Because scientists cannot go back in time <strong>to</strong> directly<br />
measure climatic variables, such as average temperature<br />
<strong>and</strong> precipitation, they must instead indirectly<br />
measure temperature. To do this, scientists rely on<br />
his<strong>to</strong>rical evidence of Earth’s past climate.<br />
<strong>An</strong>tarctic ice cores are a key example of such<br />
evidence for climate change. These ice cores are<br />
samples of polar ice obtained by means of drills that<br />
reach thous<strong>and</strong>s of meters in<strong>to</strong> ice sheets or high<br />
mountain glaciers. Viewing the ice cores is like<br />
traveling backward through time; the deeper the<br />
sample, the earlier the time period. Trapped within the<br />
ice are air bubbles <strong>and</strong> other biological evidence that<br />
can reveal temperature <strong>and</strong> carbon dioxide data.<br />
<strong>An</strong>tarctic ice cores have been collected <strong>and</strong> analyzed <strong>to</strong><br />
indirectly estimate the temperature of the Earth over<br />
the past 400,000 years.<br />
The 0°C on the graph below represents the longterm<br />
average. Temperatures that are greater than 0°C<br />
exceed Earth’s long-term average temperature.<br />
Conversely, temperatures that are less than 0°C are less<br />
than Earth’s average temperature. This figure shows<br />
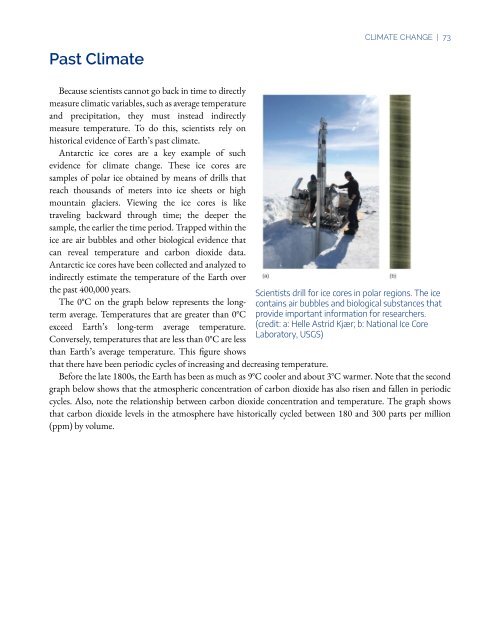
Scientists drill for ice cores in polar regions. The ice<br />
contains air bubbles <strong>and</strong> biological substances that<br />
provide important information for researchers.<br />
(credit: a: Helle Astrid Kjær; b: National Ice Core<br />
Labora<strong>to</strong>ry, USGS)<br />
that there have been periodic cycles of increasing <strong>and</strong> decreasing temperature.<br />
Before the late 1800s, the Earth has been as much as 9°C cooler <strong>and</strong> about 3°C warmer. Note that the second<br />
graph below shows that the atmospheric concentration of carbon dioxide has also risen <strong>and</strong> fallen in periodic<br />
cycles. Also, note the relationship between carbon dioxide concentration <strong>and</strong> temperature. The graph shows<br />
that carbon dioxide levels in the atmosphere have his<strong>to</strong>rically cycled between 180 <strong>and</strong> 300 parts per million<br />
(ppm) by volume.


