SUMMER 2023
Distributor's Link Magazine Summer 2023 / Vol 46 No 3
Distributor's Link Magazine Summer 2023 / Vol 46 No 3

Create successful ePaper yourself
Turn your PDF publications into a flip-book with our unique Google optimized e-Paper software.
154<br />
THE DISTRIBUTOR’S LINK<br />
ROB LaPOINTE FASTENER SCIENCE SPECTROSCOPY – THE ELEMENTAL CODE BEHIND THE CHEMISTRY OF METAL from page 130<br />
Now that we understand a bit about how electron<br />
transitions in the atom produce light, we can understand<br />
how to determine the chemistry of a material based on<br />
the light it produces when its electrons transition from high<br />
energies to lower energies. If we sample a small piece of<br />
the metal of which a fastener is made, we can put that<br />
metal in a state of high energy.<br />
Most often, this is the plasma form of the material.<br />
Plasma is formed when a material is given so much energy<br />
that its electrons are ripped away from the nuclei in a swarm<br />
of charged particles. In this plasma, electrons will make<br />
transitions with atomic nuclei and produce light related to<br />
that nucleus. The color of this light can be detected by the<br />
instrument and compared to the known spectrum of the<br />
element to find what is present in the sample. The colors<br />
detected will decide the presence of the element and the<br />
brightness of the spectrum will determine the concentration<br />
of the element.<br />
There are several different instrument configurations<br />
that have been developed to perform the task of energizing<br />
material so that it emits light and then detects the color<br />
of that light and its brightness. It is best to think of the<br />
instruments as having a frontend which is the excitation<br />
part of the instrument and a backend, which is the<br />
detection part of the instrument. Excitation can happen<br />
in a few different ways, but all are similar in that they<br />
provide an energetic environment for the electrons to have<br />
transition opportunities. Some examples of the frontend<br />
energy sources are electrical arc or spark, plasma, x-ray,<br />
and laser. Each of these has its advantage for detecting<br />
particular elements depending on the level of energy<br />
produced. Among the more popular instruments available<br />
is the Themo Fisher ARL series, which uses an electric<br />
spark to energize the material and a LECO GDS, which uses<br />
plasma to excite the sample. X-ray Fluorescence (XRF) and<br />
Laser Induced Breakdown Spectroscopy (LIBS) are popular<br />
for handheld and portable instruments.<br />
On the backend of the instrument is the detector. The<br />
detector’s job is to see the light produced and determine<br />
two things. The color (wavelength) of the light and its<br />
brightness. The tricky thing about this job is the light is very<br />
faint so the detector must be sensitive. Photo multiplier<br />
tubes (PMTs) have long been used to detect faint light and<br />
multiply its output signal into an electronic pulse that can<br />
be counted and stored. PMT based instruments must be<br />
large to accommodate the array of PMTs to be placed in the<br />
spectrum’s light path. Although PMTs are very sensitive,<br />
their large size prevents placing them in the dispersed<br />
spectrum to detect all wavelengths produced by a material.<br />
Imagine placing your eye in the path of each color being<br />
dispersed by a water droplet (Figure3) and you have a<br />
sense of how individual PMTs are arrayed in one of these<br />
machines. The fact that the detector takes up space and<br />
that not all of the detector is sensitive to light means that<br />
you’ll be missing some photons. These instruments must<br />
be set up to detect common colors emitted by the material<br />
you will hope to analyze.<br />
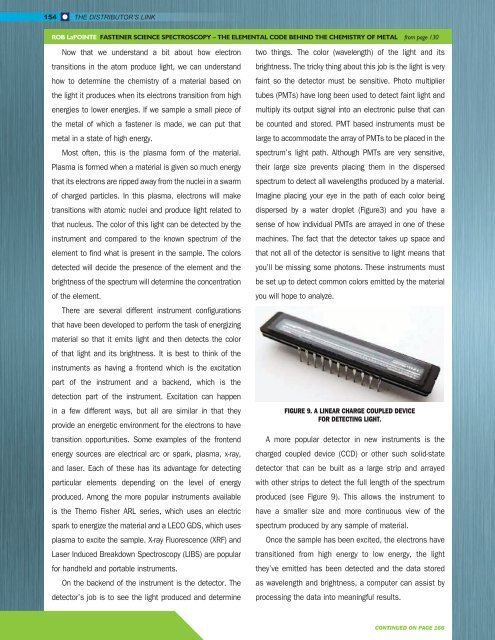
FIGURE 9. A LINEAR CHARGE COUPLED DEVICE<br />
FOR DETECTING LIGHT.<br />
A more popular detector in new instruments is the<br />
charged coupled device (CCD) or other such solid-state<br />
detector that can be built as a large strip and arrayed<br />
with other strips to detect the full length of the spectrum<br />
produced (see Figure 9). This allows the instrument to<br />
have a smaller size and more continuous view of the<br />
spectrum produced by any sample of material.<br />
Once the sample has been excited, the electrons have<br />
transitioned from high energy to low energy, the light<br />
they’ve emitted has been detected and the data stored<br />
as wavelength and brightness, a computer can assist by<br />
processing the data into meaningful results.<br />
CONTINUED ON PAGE 166