Asian Sky Quarterly 2023 Q4

You also want an ePaper? Increase the reach of your titles
YUMPU automatically turns print PDFs into web optimized ePapers that Google loves.
MARKET DYNAMICS: HELICOPTERS<br />
SUPPLY / DEMAND INDICATORS<br />
HELICOPTERS<br />
Single Light Twin Medium Twin Heavy<br />
SUPPLY VS. DEMAND RATIO<br />
SUPPLY / DEMAND INDICATORS<br />
SUPPLY<br />
> DEMAND<br />
DAYS ON MARKET<br />
AVERAGE<br />
% FOR SALE MODEL<br />
AVERAGE<br />
2.9%<br />
AS350B2<br />
1.3%<br />
AS350B3<br />
4.7%<br />
EC130B4<br />
2.3%<br />
H125<br />
3.1%<br />
H130<br />
3.4%<br />
EC135<br />
1.1%<br />
EC145<br />
0.7%<br />
H145<br />
5.1%<br />
EC155B<br />
5.7%<br />
H155<br />
2.8%<br />
H225<br />
3.2%<br />
BELL 206B-3<br />
4.1%<br />
BELL 206L-3<br />
2.1%<br />
BELL 206L-4<br />
1.5%<br />
BELL 407<br />
5.1%<br />
BELL 505<br />
2.8%<br />
BELL 429<br />
1.8%<br />
BELL 412EP<br />
9.8%<br />
AW109Grand<br />
6.1%<br />
AW109SP GN<br />
2.2%<br />
AW139<br />
4.9%<br />
S76C+<br />
3.9%<br />
S76C++<br />
350% 300% 250% 200% 150% 100% 50% 0 2.67%<br />
0 100 200 300 400 500 600 700 800<br />
Average<br />
Average AC for sale / Total sold in last 12 months<br />
Average Days for Sale on Market<br />
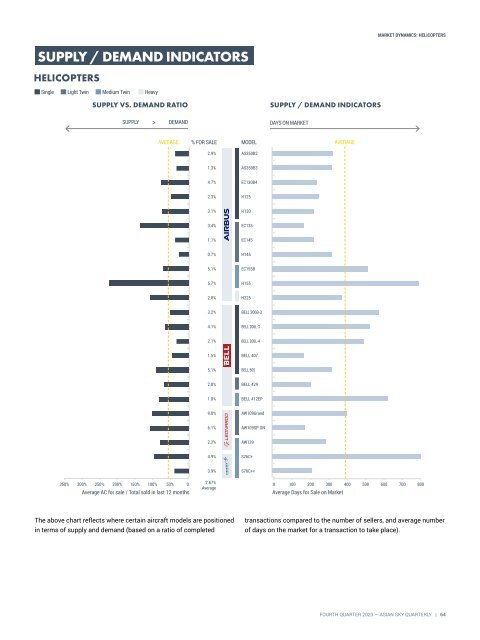
The above chart reflects where certain aircraft models are positioned<br />
in terms of supply and demand (based on a ratio of completed<br />
transactions compared to the number of sellers, and average number<br />
of days on the market for a transaction to take place).<br />
FOURTH QUARTER <strong>2023</strong> — ASIAN SKY QUARTERLY | 64