Annual Report 3 - New Mexico - Energy, Minerals and Natural ...
Annual Report 3 - New Mexico - Energy, Minerals and Natural ...
Annual Report 3 - New Mexico - Energy, Minerals and Natural ...

Create successful ePaper yourself
Turn your PDF publications into a flip-book with our unique Google optimized e-Paper software.
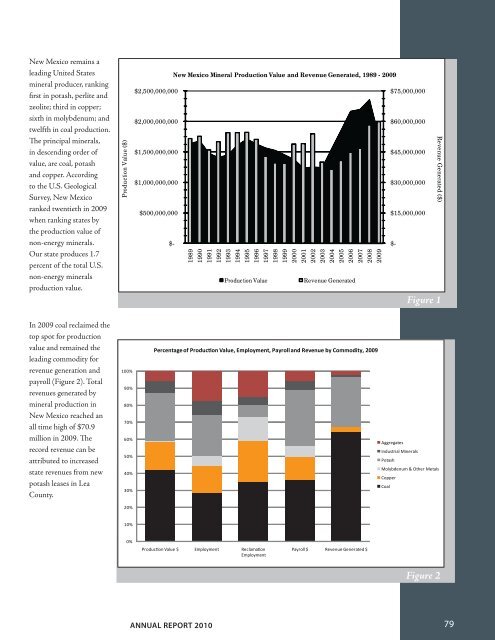
<strong>New</strong> <strong>Mexico</strong> remains a<br />
leading United States<br />
mineral producer, ranking<br />
first in potash, perlite <strong>and</strong><br />
zeolite; third in copper;<br />
sixth in molybdenum; <strong>and</strong><br />
twelfth in coal production.<br />
The principal minerals,<br />
in descending order of<br />
value, are coal, potash<br />
<strong>and</strong> copper. According<br />
to the U.S. Geological<br />
Survey, <strong>New</strong> <strong>Mexico</strong><br />
ranked twentieth in 2009<br />
when ranking states by<br />
the production value of<br />
non-energy minerals.<br />
Our state produces 1.7<br />
percent of the total U.S.<br />
non-energy minerals<br />
production value.<br />
In 2009 coal reclaimed the<br />
top spot for production<br />
value <strong>and</strong> remained the<br />
leading commodity for<br />
revenue generation <strong>and</strong><br />
payroll (Figure 2). Total<br />
revenues generated by<br />
mineral production in<br />
<strong>New</strong> <strong>Mexico</strong> reached an<br />
all time high of $70.9<br />
million in 2009. The<br />
record revenue can be<br />
attributed to increased<br />
state revenues from new<br />
potash leases in Lea<br />
County.<br />
Production Value ($)<br />
100%<br />
90%<br />
80%<br />
70%<br />
60%<br />
50%<br />
40%<br />
30%<br />
20%<br />
10%<br />
0%<br />
$2,500,000,000<br />
$2,000,000,000<br />
$1,500,000,000<br />
$1,000,000,000<br />
$500,000,000<br />
$-<br />
ANNUAL REPORT 2010<br />
<strong>New</strong> <strong>Mexico</strong> Mineral Production Value <strong>and</strong> Revenue Generated, 1989 - 2009<br />
1989<br />
1990<br />
1991<br />
1992<br />
1993<br />
1994<br />
1995<br />
1996<br />
1997<br />
1998<br />
1999<br />
2000<br />
2001<br />
2002<br />
2003<br />
2004<br />
2005<br />
2006<br />
2007<br />
2008<br />
2009<br />
Production Value Revenue Generated<br />
Percentage of Production Value, Employment, Payroll <strong>and</strong> Revenue by Commodity, 2009<br />
Production Value $ Employment Reclamation<br />
Employment<br />
Payroll $ Revenue Generated $<br />
$75,000,000<br />
$60,000,000<br />
$45,000,000<br />
$30,000,000<br />
$15,000,000<br />
$-<br />
Aggregates<br />
Industrial <strong>Minerals</strong><br />
Potash<br />
Revenue Generated ($)<br />
Figure 1<br />
Molybdenum & Other Metals<br />
Copper<br />
Coal<br />
Figure 2<br />
79