Download 2007 Annual Report in PDF (4.8Mb - VimpelCom
Download 2007 Annual Report in PDF (4.8Mb - VimpelCom
Download 2007 Annual Report in PDF (4.8Mb - VimpelCom

Create successful ePaper yourself
Turn your PDF publications into a flip-book with our unique Google optimized e-Paper software.
44<br />
<strong>VimpelCom</strong> / <strong>Annual</strong> <strong>Report</strong> <strong>2007</strong><br />
base, a high proportion of which consisted of lower <strong>in</strong>come mass market<br />
subscribers, who typically use their cellular telephone less than higher<br />
<strong>in</strong>come subscribers.<br />
Armenia. In <strong>2007</strong>, our MOU <strong>in</strong> Armenia decreased by 4.5% to 169.9 from 178.0<br />
<strong>in</strong> 2006. Our MOU decreased due to the fact that MOU for 2006 represents only<br />
the last two months of 2006 where there is typically higher mobile usage due<br />
to holidays.<br />
ARPU<br />
We calculate ARPU, a non-U.S. GAAP f<strong>in</strong>ancial measure, by divid<strong>in</strong>g our<br />
service revenue dur<strong>in</strong>g the relevant period, <strong>in</strong>clud<strong>in</strong>g roam<strong>in</strong>g revenue and<br />
<strong>in</strong>terconnect revenue, but exclud<strong>in</strong>g revenue from connection fees, sales<br />
of handsets and accessories and other non-service revenue, by the average<br />
number of our active mobile subscribers dur<strong>in</strong>g the period and divid<strong>in</strong>g by<br />
the number of months <strong>in</strong> that period. Reconciliation of ARPU to service<br />
revenues, the most directly comparable U.S. GAAP f<strong>in</strong>ancial measure, is<br />
presented below <strong>in</strong> «Additional Reconciliation of Non-U.S. GAAP F<strong>in</strong>ancial<br />
Measures (Unaudited).» We believe that ARPU provides useful <strong>in</strong>formation<br />
to <strong>in</strong>vestors because it is an <strong>in</strong>dicator of the performance of our mobile<br />
operations and assists management <strong>in</strong> budget<strong>in</strong>g. We also believe that<br />
ARPU provides management with useful <strong>in</strong>formation concern<strong>in</strong>g usage and<br />
acceptance of our mobile services. ARPU should not be viewed <strong>in</strong> isolation or<br />
as an alternative to other figures reported under U.S. GAAP.<br />
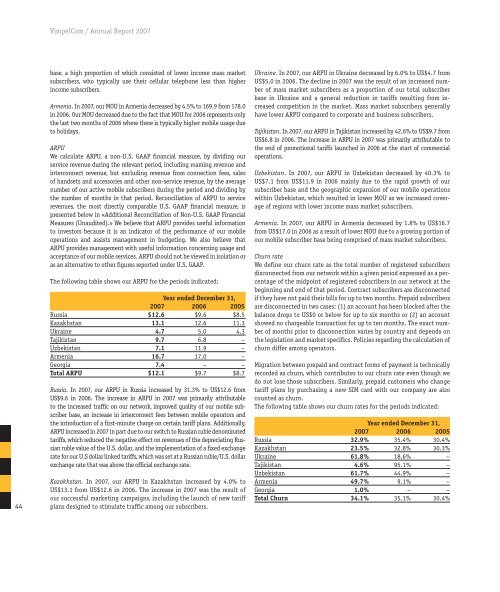
The follow<strong>in</strong>g table shows our ARPU for the periods <strong>in</strong>dicated:<br />
Year ended December 31,<br />
<strong>2007</strong> 2006 2005<br />
Russia $12.6 $9.6 $8.5<br />
Kazakhstan 13.1 12.6 11.3<br />
Ukra<strong>in</strong>e 4.7 5.0 4.3<br />
Tajikistan 9.7 6.8 –<br />
Uzbekistan 7.1 11.9 –<br />
Armenia 16.7 17.0 –<br />
Georgia 7.4 – –<br />
Total ARPU $12.1 $9.7 $8.7<br />
Russia. In <strong>2007</strong>, our ARPU <strong>in</strong> Russia <strong>in</strong>creased by 31.3% to US$12.6 from<br />
US$9.6 <strong>in</strong> 2006. The <strong>in</strong>crease <strong>in</strong> ARPU <strong>in</strong> <strong>2007</strong> was primarily attributable<br />
to the <strong>in</strong>creased traffic on our network, improved quality of our mobile subscriber<br />
base, an <strong>in</strong>crease <strong>in</strong> <strong>in</strong>terconnect fees between mobile operators and<br />
the <strong>in</strong>troduction of a first-m<strong>in</strong>ute charge on certa<strong>in</strong> tariff plans. Additionally,<br />
ARPU <strong>in</strong>creased <strong>in</strong> <strong>2007</strong> <strong>in</strong> part due to our switch to Russian ruble denom<strong>in</strong>ated<br />
tariffs, which reduced the negative effect on revenues of the depreciat<strong>in</strong>g Russian<br />
ruble value of the U.S. dollar, and the implementation of a fixed exchange<br />
rate for our U.S dollar l<strong>in</strong>ked tariffs, which was set at a Russian ruble/U.S. dollar<br />
exchange rate that was above the official exchange rate.<br />
Kazakhstan. In <strong>2007</strong>, our ARPU <strong>in</strong> Kazakhstan <strong>in</strong>creased by 4.0% to<br />
US$13.1 from US$12.6 <strong>in</strong> 2006. The <strong>in</strong>crease <strong>in</strong> <strong>2007</strong> was the result of<br />
our successful market<strong>in</strong>g campaigns, <strong>in</strong>clud<strong>in</strong>g the launch of new tariff<br />
plans designed to stimulate traffic among our subscribers.<br />
Ukra<strong>in</strong>e. In <strong>2007</strong>, our ARPU <strong>in</strong> Ukra<strong>in</strong>e decreased by 6.0% to US$4.7 from<br />
US$5.0 <strong>in</strong> 2006. The decl<strong>in</strong>e <strong>in</strong> <strong>2007</strong> was the result of an <strong>in</strong>creased number<br />
of mass market subscribers as a proportion of our total subscriber<br />
base <strong>in</strong> Ukra<strong>in</strong>e and a general reduction <strong>in</strong> tariffs result<strong>in</strong>g from <strong>in</strong>creased<br />
competition <strong>in</strong> the market. Mass market subscribers generally<br />
have lower ARPU compared to corporate and bus<strong>in</strong>ess subscribers.<br />
Tajikistan. In <strong>2007</strong>, our ARPU <strong>in</strong> Tajikistan <strong>in</strong>creased by 42.6% to US$9.7 from<br />
US$6.8 <strong>in</strong> 2006. The <strong>in</strong>crease <strong>in</strong> ARPU <strong>in</strong> <strong>2007</strong> was primarily attributable to<br />
the end of promotional tariffs launched <strong>in</strong> 2006 at the start of commercial<br />
operations.<br />
Uzbekistan. In <strong>2007</strong>, our ARPU <strong>in</strong> Uzbekistan decreased by 40.3% to<br />
US$7.1 from US$11.9 <strong>in</strong> 2006 ma<strong>in</strong>ly due to the rapid growth of our<br />
subscriber base and the geographic expansion of our mobile operations<br />
with<strong>in</strong> Uzbekistan, which resulted <strong>in</strong> lower MOU as we <strong>in</strong>creased coverage<br />
of regions with lower <strong>in</strong>come mass market subscribers.<br />
Armenia. In <strong>2007</strong>, our ARPU <strong>in</strong> Armenia decreased by 1.8% to US$16.7<br />
from US$17.0 <strong>in</strong> 2006 as a result of lower MOU due to a grow<strong>in</strong>g portion of<br />
our mobile subscriber base be<strong>in</strong>g comprised of mass market subscribers.<br />
Churn rate<br />
We def<strong>in</strong>e our churn rate as the total number of registered subscribers<br />
disconnected from our network with<strong>in</strong> a given period expressed as a percentage<br />
of the midpo<strong>in</strong>t of registered subscribers <strong>in</strong> our network at the<br />
beg<strong>in</strong>n<strong>in</strong>g and end of that period. Contract subscribers are disconnected<br />
if they have not paid their bills for up to two months. Prepaid subscribers<br />
are disconnected <strong>in</strong> two cases: (1) an account has been blocked after the<br />
balance drops to US$0 or below for up to six months or (2) an account<br />
showed no chargeable transaction for up to ten months. The exact number<br />
of months prior to disconnection varies by country and depends on<br />
the legislation and market specifics. Policies regard<strong>in</strong>g the calculation of<br />
churn differ among operators.<br />
Migration between prepaid and contract forms of payment is technically<br />
recorded as churn, which contributes to our churn rate even though we<br />
do not lose those subscribers. Similarly, prepaid customers who change<br />
tariff plans by purchas<strong>in</strong>g a new SIM card with our company are also<br />
counted as churn.<br />
The follow<strong>in</strong>g table shows our churn rates for the periods <strong>in</strong>dicated:<br />
Year ended December 31,<br />
<strong>2007</strong> 2006 2005<br />
Russia 32.9% 35.4% 30.4%<br />
Kazakhstan 23.5% 32.8% 30.3%<br />
Ukra<strong>in</strong>e 61.8% 18.6% –<br />
Tajikistan 4.6% 95.1% –<br />
Uzbekistan 61.7% 44.9% –<br />
Armenia 49.7% 9.1% –<br />
Georgia 1.0% – –<br />
Total Churn 34.1% 35.1% 30.4%