Download 2007 Annual Report in PDF (4.8Mb - VimpelCom
Download 2007 Annual Report in PDF (4.8Mb - VimpelCom
Download 2007 Annual Report in PDF (4.8Mb - VimpelCom
You also want an ePaper? Increase the reach of your titles
YUMPU automatically turns print PDFs into web optimized ePapers that Google loves.
Our <strong>in</strong>terest bear<strong>in</strong>g liabilities carry both fixed and float<strong>in</strong>g <strong>in</strong>terest<br />
rates. On our borrow<strong>in</strong>gs with a float<strong>in</strong>g <strong>in</strong>terest rate, the <strong>in</strong>terest rate<br />
is l<strong>in</strong>ked either to LIBOR or to EURIBOR. Our <strong>in</strong>terest expense depends<br />
on a comb<strong>in</strong>ation of prevail<strong>in</strong>g <strong>in</strong>terest rates and the amount of our<br />
outstand<strong>in</strong>g <strong>in</strong>terest bear<strong>in</strong>g liabilities.<br />
Income tax expense. Income tax expense <strong>in</strong>cluded both current and<br />
deferred tax expense. The statutory <strong>in</strong>come tax rate <strong>in</strong> Russia is 24.0%.<br />
The statutory <strong>in</strong>come tax rate <strong>in</strong> Kazakhstan is 30.0%. The statutory<br />
<strong>in</strong>come tax rate <strong>in</strong> Ukra<strong>in</strong>e and Tajikistan is 25.0%. The statutory<br />
<strong>in</strong>come tax rate <strong>in</strong> Armenia and Georgia is 20.0%. In Uzbekistan there is<br />
a complex <strong>in</strong>come tax regime that results <strong>in</strong> an effective <strong>in</strong>come tax rate<br />
of approximately 17%.<br />
Results of Operations<br />
The follow<strong>in</strong>g is a discussion of <strong>VimpelCom</strong>’s results of operations for<br />
the periods <strong>in</strong>dicated. Golden Telecom’s results of operations were not<br />
consolidated with <strong>VimpelCom</strong>’s results of operations as of December 31,<br />
<strong>2007</strong> and, consequently, are not discussed below.<br />
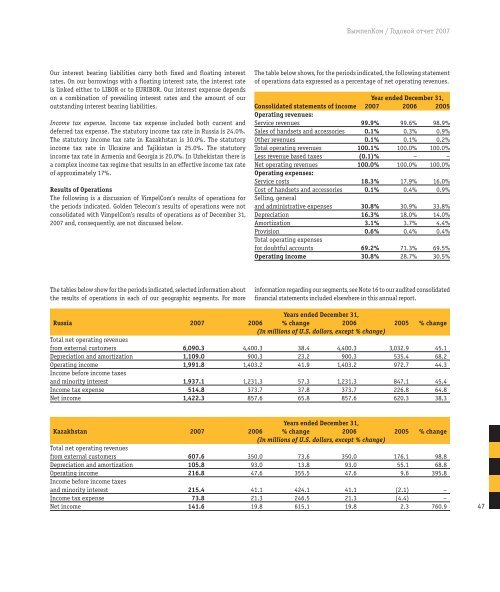
The tables below show for the periods <strong>in</strong>dicated, selected <strong>in</strong>formation about<br />
the results of operations <strong>in</strong> each of our geographic segments. For more<br />
ВымпелКом / Годовой отчет <strong>2007</strong><br />
The table below shows, for the periods <strong>in</strong>dicated, the follow<strong>in</strong>g statement<br />
of operations data expressed as a percentage of net operat<strong>in</strong>g revenues.<br />
Year ended December 31,<br />
Consolidated statements of <strong>in</strong>come <strong>2007</strong> 2006 2005<br />
Operat<strong>in</strong>g revenues:<br />
Service revenues 99.9% 99.6% 98.9%<br />
Sales of handsets and accessories 0.1% 0.3% 0.9%<br />
Other revenues 0.1% 0.1% 0.2%<br />
Total operat<strong>in</strong>g revenues 100.1% 100.0% 100.0%<br />
Less revenue based taxes (0.1)% – –<br />
Net operat<strong>in</strong>g revenues 100.0% 100.0% 100.0%<br />
Operat<strong>in</strong>g expenses:<br />
Service costs 18.3% 17.9% 16.0%<br />
Cost of handsets and accessories 0.1% 0.4% 0.9%<br />
Sell<strong>in</strong>g, general<br />
and adm<strong>in</strong>istrative expenses 30.8% 30.9% 33.8%<br />
Depreciation 16.3% 18.0% 14.0%<br />
Amortization 3.1% 3.7% 4.4%<br />
Provision 0.6% 0.4% 0.4%<br />
Total operat<strong>in</strong>g expenses<br />
for doubtful accounts 69.2% 71.3% 69.5%<br />
Operat<strong>in</strong>g <strong>in</strong>come 30.8% 28.7% 30.5%<br />
<strong>in</strong>formation regard<strong>in</strong>g our segments, see Note 16 to our audited consolidated<br />
f<strong>in</strong>ancial statements <strong>in</strong>cluded elsewhere <strong>in</strong> this annual report.<br />
Years ended December 31,<br />
Russia <strong>2007</strong> 2006 % change 2006 2005 % change<br />
(In millions of U.S. dollars, except % change)<br />
Total net operat<strong>in</strong>g revenues<br />
from external customers 6,090.3 4,400.3 38.4 4,400.3 3,032.9 45.1<br />
Depreciation and amortization 1,109.0 900.3 23.2 900.3 535.4 68.2<br />
Operat<strong>in</strong>g <strong>in</strong>come 1,991.8 1,403.2 41.9 1,403.2 972.7 44.3<br />
Income before <strong>in</strong>come taxes<br />
and m<strong>in</strong>ority <strong>in</strong>terest 1,937.1 1,231.3 57.3 1,231.3 847.1 45.4<br />
Income tax expense 514.8 373.7 37.8 373.7 226.8 64.8<br />
Net <strong>in</strong>come 1,422.3 857.6 65.8 857.6 620.3 38.3<br />
Years ended December 31,<br />
Kazakhstan <strong>2007</strong> 2006 % change 2006 2005 % change<br />
(In millions of U.S. dollars, except % change)<br />
Total net operat<strong>in</strong>g revenues<br />
from external customers 607.6 350.0 73.6 350.0 176.1 98.8<br />
Depreciation and amortization 105.8 93.0 13.8 93.0 55.1 68.8<br />
Operat<strong>in</strong>g <strong>in</strong>come 216.8 47.6 355.5 47.6 9.6 395.8<br />
Income before <strong>in</strong>come taxes<br />
and m<strong>in</strong>ority <strong>in</strong>terest 215.4 41.1 424.1 41.1 (2.1) –<br />
Income tax expense 73.8 21.3 246.5 21.3 (4.4) –<br />
Net <strong>in</strong>come 141.6 19.8 615.1 19.8 2.3 760.9<br />
47


