Equity Trading
Equity Trading
Equity Trading

You also want an ePaper? Increase the reach of your titles
YUMPU automatically turns print PDFs into web optimized ePapers that Google loves.
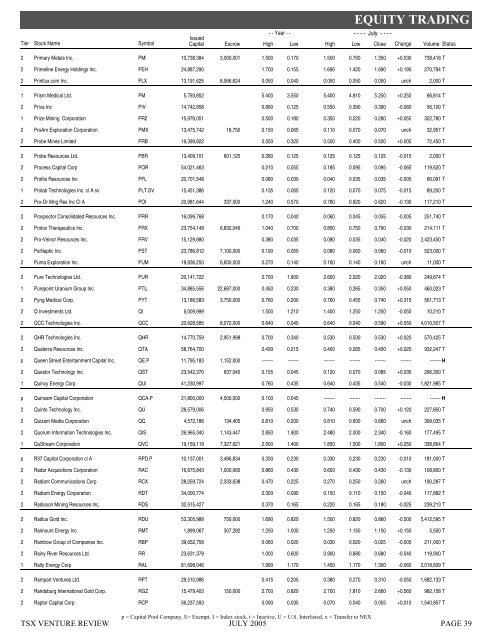
EQUITY TRADING<br />
- - Year - - - - - - July - - - -<br />
Issued<br />
Tier Stock Name Symbol Capital Escrow High Low<br />
High Low Close Change Volume Status<br />
2 Primary Metals Inc. PMI 10,738,384 3,000,001 1.500 0.170 1.500 0.760 1.350 +0.530 738,418 T<br />
.00<br />
2 Primeline Energy Holdings Inc. PEH 24,887,290<br />
1.700 0.155 1.690 1.420 1.690 +0.190 270,794 T<br />
.00<br />
2 Printlux.com Inc. PLX 13,191,625 8,066,624 0.050 0.040 0.050 0.050 0.050 unch 2,000 T<br />
.00<br />
1 Prism Medical Ltd. PM 5,793,852<br />
5.400 3.550 5.400 4.810 5.250 +0.250 66,814 T<br />
.00<br />
2 Priva Inc PIV 14,742,858<br />
0.890 0.125 0.550 0.390 0.390 -0.060 56,100 T<br />
.00<br />
1 Prize Mining Corporation PRZ 15,976,051<br />
0.500 0.180 0.350 0.220 0.280 +0.055 322,780 T<br />
.00<br />
2 ProAm Exploration Corporation PMX 13,475,742 18,750 0.150 0.065 0.110 0.070 0.070 unch 32,957 T<br />
.00<br />
2 Probe Mines Limited PRB 19,399,822<br />
0.550 0.320 0.500 0.400 0.500 +0.005 72,450 T<br />
.00<br />
2 Probe Resources Ltd. PBR 13,409,101 601,125 0.280 0.125 0.125 0.125 0.125 -0.015 2,000 T<br />
.00<br />
2 Process Capital Corp POR 54,021,463<br />
0.210 0.055 0.185 0.095 0.095 -0.065 119,620 T<br />
.00<br />
2 Profile Resources Inc PFL 20,701,548<br />
0.080 0.030 0.040 0.035 0.035 -0.005 66,091 T<br />
.00<br />
1 Prolab Technologies Inc. cl A sv PLT.SV 15,451,386<br />
0.135 0.065 0.120 0.070 0.075 -0.015 89,200 T<br />
.00<br />
2 Pro-Or Mng Res Inc Cl A POI 20,981,644 337,500 1.240 0.570 0.780 0.620 0.620 -0.130 117,210 T<br />
.00<br />
2 Prospector Consolidated Resources Inc. PRR 16,099,768<br />
0.170 0.040 0.060 0.045 0.055 -0.005 251,740 T<br />
.00<br />
2 Protox Therapeutics Inc. PRX 23,754,148 6,832,046 1.040 0.700 0.850 0.750 0.790 -0.030 214,111 T<br />
.00<br />
2 Pro-Veinor Resources Inc. PRV 15,129,880<br />
0.380 0.035 0.080 0.035 0.040 -0.020 2,423,450 T<br />
.00<br />
2 PsiNaptic Inc. PST 23,786,812 7,100,000 0.190 0.050 0.080 0.060 0.060 -0.010 523,000 T<br />
.00<br />
2 Puma Exploration Inc. PUM 18,836,250 6,600,000 0.270 0.140 0.160 0.140 0.160 unch 11,000 T<br />
.00<br />
2 Pure Technologies Ltd. PUR 20,141,722<br />
2.700 1.900 2.600 2.020 2.020 -0.380 249,674 T<br />
.00<br />
1 Purepoint Uranium Group Inc. PTU 34,885,556 22,687,000 0.450 0.230 0.380 0.265 0.350 +0.050 460,023 T<br />
.00<br />
2 Pyng Medical Corp. PYT 13,186,583 3,750,000 0.760 0.200 0.760 0.455 0.740 +0.315 561,713 T<br />
.00<br />
2 Q Investments Ltd. QI 6,009,999<br />
1.500 1.210 1.400 1.250 1.250 -0.050 10,210 T<br />
.00<br />
2 QCC Technologies Inc. QCC 20,628,585 8,072,000 0.640 0.040 0.640 0.040 0.590 +0.550 4,010,507 T<br />
.00<br />
2 QHR Technologies Inc. QHR 14,770,759 2,951,998 0.700 0.340 0.530 0.500 0.530 +0.020 570,425 T<br />
.00<br />
2 Quaterra Resources Inc. QTA 58,764,700<br />
0.430 0.215 0.400 0.265 0.400 +0.020 932,247 T<br />
.00<br />
p Queen Street Entertainment Capital Inc. QE.P 11,795,183 1,152,000 ------- ------- ------- ------- ------- ------- ------- H<br />
.00<br />
2 Questor Technology Inc. QST 23,542,370 637,045 0.155 0.045 0.120 0.070 0.085 +0.035 296,300 T<br />
.00<br />
1 Quincy Energy Corp. QUI 41,230,997<br />
0.760 0.435 0.640 0.435 0.540 -0.030 1,821,985 T<br />
.00<br />
p Quinsam Capital Corporation QCA.P 21,800,000 4,500,000 0.100 0.045 ------- ------- ------- ------- ------- H<br />
.00<br />
2 Quinto Technology Inc. QU 28,579,006<br />
0.950 0.530 0.740 0.590 0.700 +0.120 227,850 T<br />
.00<br />
2 Quizam Media Corporation QQ 4,572,186 134,405 0.810 0.200 0.810 0.600 0.660 unch 399,035 T<br />
.00<br />
2 Quorum Information Technologies Inc. QIS 26,965,340 1,143,447 2.850 1.900 2.480 2.000 2.340 -0.160 177,495 T<br />
.00<br />
1 QuStream Corporation QVC 19,159,119 7,327,621 2.500 1.400 1.850 1.500 1.800 +0.250 338,854 T<br />
.00<br />
p R37 Capital Corporation cl A RPD.P 10,137,001 3,486,834 0.330 0.230 0.330 0.230 0.230 -0.010 181,000 T<br />
.00<br />
2 Radar Acquisitions Corporation RAC 16,675,843 1,000,060 0.860 0.430 0.600 0.430 0.430 -0.130 108,800 T<br />
.00<br />
2 Radiant Communications Corp RCX 28,259,724 2,333,638 0.470 0.225 0.270 0.250 0.260 unch 190,287 T<br />
.00<br />
2 Radiant Energy Corporation RDT 34,000,774<br />
0.300 0.090 0.150 0.110 0.150 -0.040 117,882 T<br />
.00<br />
2 Radisson Mining Resources Inc. RDS 32,515,427<br />
0.370 0.165 0.220 0.165 0.180 -0.025 239,213 T<br />
.00<br />
2 Radius Gold Inc. RDU 53,305,988 750,000 1.690 0.820 1.500 0.820 0.860 -0.500 5,412,595 T<br />
.00<br />
2 Raimount Energy Inc. RMT 1,899,067 307,282 1.250 1.000 1.250 1.150 1.150 +0.150 5,500 T<br />
.00<br />
2 Rainbow Group of Companies Inc. RBP 39,652,758<br />
0.060 0.020 0.030 0.020 0.025 -0.005 211,000 T<br />
.00<br />
2 Rainy River Resources Ltd. RR 23,631,378<br />
1.000 0.600 0.900 0.680 0.680 -0.040 119,900 T<br />
.00<br />
1 Rally Energy Corp RAL 81,698,046<br />
1.990 1.170 1.450 1.170 1.300 -0.060 2,018,609 T<br />
.00<br />
2 Rampart Ventures Ltd. RPT 29,510,986<br />
0.415 0.205 0.380 0.270 0.310 -0.050 1,682,133 T<br />
.00<br />
2 Randsburg International Gold Corp. RGZ 15,479,403 150,000 2.700 0.820 2.700 1.810 2.660 +0.560 982,158 T<br />
.00<br />
2 Raptor Capital Corp RCP 56,237,593<br />
0.090 0.035 0.070 0.040 0.055 +0.010 1,540,857 T<br />
.00<br />
TSX VENTURE REVIEW<br />
p = Capital Pool Company, E= Exempt, I = Index stock, t = Inactive, U = U.S. Interlisted, x = Transfer to NEX<br />
JULY 2005<br />
PAGE 39<br />
.<br />
.<br />
.<br />
.<br />
.<br />
.<br />
.<br />
.<br />
.