10 ADVANCES IN ELECTRONICS AND TELECOMMUNICATIONS, VOL. 1, NO. 1, APRIL 2010 where {am} are <strong>in</strong>dependent chi-square r<strong>and</strong>om variables with am ∼ χ2 2(N−m+1) . We observe that, for reasonable values of θ (e.g., θ = 5 − 20 dB), an outage roughly occurs when the <strong>in</strong>terference power z obta<strong>in</strong>s a large value. In this case, the geometric mean of {1 + am z }Mm=1 is approximately equal to the arithmetic mean, thus � M� � P 1+ am � � � 1 M� � M 1
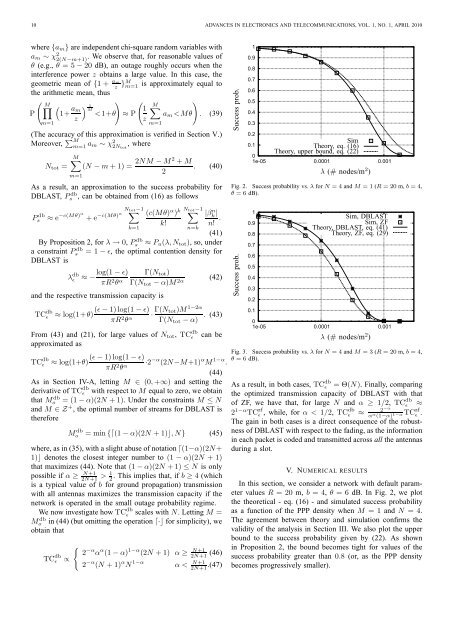
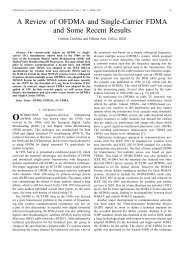
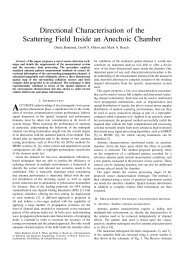
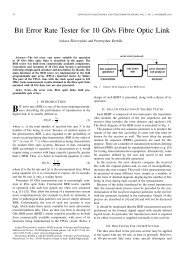
STAMATIOU et al.: SPATIAL MULTIPLEXING IN RANDOM WIRELESS NETWORKS 11 Transm. cap. (nats/symbol/m 2 ) 0.0003 0.00025 0.0002 0.00015 N = 8 0.0001 5e-05 N = 4 DB, eq. (43) Sim, DB ZF, eq. (32) Sim, ZF VB, eq. (36) Sim, VB 0 1 2 3 4 5 6 7 8 Fig. 4. Transmission capacity vs. M for N = 4, 8 (ǫ = 0.1, R = 20 m, b = 3, θ = 6 dB). The optimal number of streams for DBLAST is 3 when N = 4, <strong>and</strong> 6 when N = 8. These numbers are <strong>in</strong> accordance with (45). In the case of ZF, the optimal number of streams is 1 when N = 4, <strong>and</strong> 3 when N = 8. These numbers are also <strong>in</strong> accordance with (35). To avoid clutter<strong>in</strong>g the figure, DBLAST is denoted as DB <strong>and</strong> VBLAST as VB. Transm. cap. (nats/symbol/m 2 ) 0.0004 0.00035 0.0003 0.00025 0.0002 M N = 8 0.00015 0.0001 5e-05 N = 4 DB, eq. (43) Sim, DB ZF, eq. (32) Sim, ZF VB, eq. (36) Sim, VB 1 2 3 4 5 6 7 8 Fig. 5. Transmission capacity vs. M for N = 4, 8 (ǫ = 0.1, R = 20 m, b = 4, θ = 6 dB). To avoid clutter<strong>in</strong>g the figure, DBLAST is denoted as DB <strong>and</strong> VBLAST as VB. In Fig. 3, the theoretical <strong>and</strong> simulated success probability of ZF <strong>and</strong> DBLAST are plotted vs. the density of the PPP for a system where M = 3 antennas are employed <strong>in</strong> each TX. The agreement between theory <strong>and</strong> simulation is once aga<strong>in</strong> very satisfactory, which, <strong>in</strong> the case of DBLAST, confirms the validity of the approximations <strong>in</strong> Section IV-C. Fig. 4 shows the dependence of the transmission capacity on the number of transmitted streams for the three MIMO techniques considered <strong>in</strong> Section IV. The total number of antennas takes two values N = 4, 8, the propagation exponent is b = 3 <strong>and</strong> a constra<strong>in</strong>t ǫ = 0.1 is placed on the outage probability. The DBLAST transmission scheme results <strong>in</strong> higher transmission capacity compared to VBLAST or simple ZF. Moreover, the ga<strong>in</strong> between VBLAST <strong>and</strong> simple ZF is marg<strong>in</strong>al, which is attributed to the fact that, with VBLAST, the maximum contention density is still determ<strong>in</strong>ed by the sub<strong>channel</strong> with the smallest diversity order. M Transm. cap. (nats/symbol/m 2 ) 4e-05 3.5e-05 3e-05 2.5e-05 2e-05 1.5e-05 1e-05 5e-06 DBLAST Sim, DBLAST ZF Sim, ZF ZF, M = N Sim, ZF, M = N MRC Sim, MRC 0 1 2 3 4 5 6 7 8 Fig. 6. Transmission capacity vs. N (ǫ = 0.01, R = 20 m, b = 4, θ = 6 dB). If all TX antennas are activated, the transmission capacity of ZF is lower than the transmission capacity of MRC, even though the scal<strong>in</strong>g <strong>in</strong> both cases is Θ( √ N). Sett<strong>in</strong>g M = N <strong>and</strong> b = 4 <strong>in</strong> (32) we can also see that TCzf TCǫ ǫ ≈ , which is confirmed by the plot. Γ(1/2) Optimal M 8 7 6 5 4 3 2 1 DBLAST ZF 1 2 3 4 5 6 7 8 N Fig. 7. Optimal number of streams vs. N (ǫ = 0.01, R = 20 m, b = 4, θ = 6 dB). In Fig. 5, the propagation exponent takes the value b = 4. As predicted <strong>in</strong> Section IV-C, activat<strong>in</strong>g all the TX antennas maximizes the transmission capacity for DBLAST. In the case of ZF, the optimal number of streams is dictated by (35). Overall, <strong>in</strong> both Fig. 4 <strong>and</strong> Fig. 5, the agreement between theory <strong>and</strong> simulation is satisfactory. In Fig. 6 <strong>and</strong> Fig. 7, the transmission capacity <strong>and</strong> the respective - optimal - number of streams are plotted vs. N for DBLAST, ZF <strong>and</strong> MRC <strong>and</strong> an outage probability constra<strong>in</strong>t ǫ = 0.01. As predicted <strong>in</strong> Section IV, <strong>in</strong> the case of DBLAST <strong>and</strong> ZF, <strong>and</strong> optimally selected M, the transmission capacity scales l<strong>in</strong>early <strong>in</strong> N, while, <strong>in</strong> the case of MRC, it scales as N α = √ N. At N ≥ 3, DBLAST provides a capacity ga<strong>in</strong> of approximately 1.4 compared to ZF, which is <strong>in</strong> agreement with the √ 2 ga<strong>in</strong> predicted at the end of Section IV-C. Moreover, it is observed that, for N ≤ 3, MRC <strong>and</strong> ZF result <strong>in</strong> approximately the same transmission capacity. N