TCS Corporate Sustainability Report 2010-11 - Tata Consultancy ...
TCS Corporate Sustainability Report 2010-11 - Tata Consultancy ...
TCS Corporate Sustainability Report 2010-11 - Tata Consultancy ...

Create successful ePaper yourself
Turn your PDF publications into a flip-book with our unique Google optimized e-Paper software.
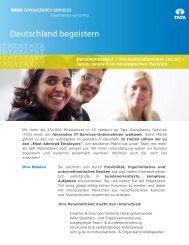
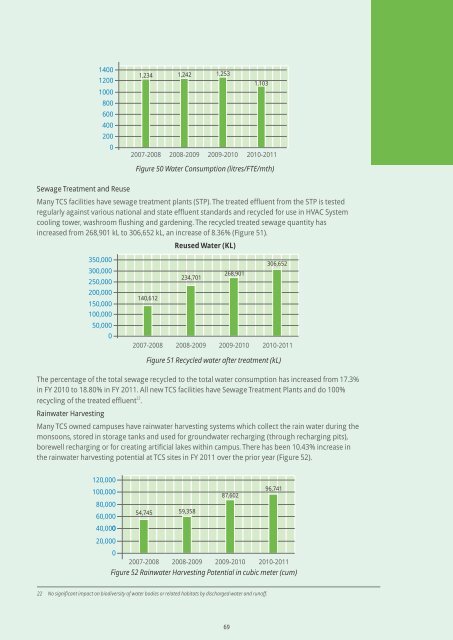
Sewage Treatment and Reuse<br />
Many <strong>TCS</strong> facilities have sewage treatment plants (STP). The treated effluent from the STP is tested<br />
regularly against various national and state effluent standards and recycled for use in HVAC System<br />
cooling tower, washroom flushing and gardening. The recycled treated sewage quantity has<br />
increased from 268,901 kL to 306,652 kL, an increase of 8.36% (Figure 51).<br />
The percentage of the total sewage recycled to the total water consumption has increased from 17.3%<br />
in FY <strong>2010</strong> to 18.80% in FY 20<strong>11</strong>. All new <strong>TCS</strong> facilities have Sewage Treatment Plants and do 100%<br />
22<br />
recycling of the treated effluent .<br />
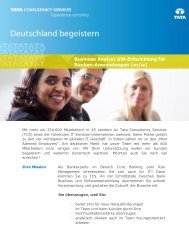
Rainwater Harvesting<br />
1400<br />
1200<br />
1000<br />
800<br />
600<br />
400<br />
200<br />
0<br />
350,000<br />
300,000<br />
250,000<br />
200,000<br />
150,000<br />
100,000<br />
50,000<br />
0<br />
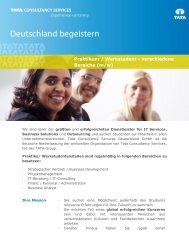
1,234 1,242 1,253<br />
2007-2008 2008-2009 2009-<strong>2010</strong> <strong>2010</strong>-20<strong>11</strong><br />
Many <strong>TCS</strong> owned campuses have rainwater harvesting systems which collect the rain water during the<br />
monsoons, stored in storage tanks and used for groundwater recharging (through recharging pits),<br />
borewell recharging or for creating artificial lakes within campus. There has been 10.43% increase in<br />
the rainwater harvesting potential at <strong>TCS</strong> sites in FY 20<strong>11</strong> over the prior year (Figure 52).<br />
120,000<br />
100,000<br />
80,000<br />
60,000<br />
40,000 0<br />
20,000<br />
22 No significant impact on biodiversity of water bodies or related habitats by discharged water and runoff.<br />
69<br />
1,103<br />
Figure 50 Water Consumption (litres/FTE/mth)<br />
140,612<br />
Reused Water (KL)<br />
234,701<br />
268,901<br />
306,652<br />
2007-2008 2008-2009 2009-<strong>2010</strong> <strong>2010</strong>-20<strong>11</strong><br />
54,745<br />
Figure 51 Recycled water after treatment (kL)<br />
59,358<br />
87,602<br />
96,741<br />
0<br />
2007-2008 2008-2009 2009-<strong>2010</strong> <strong>2010</strong>-20<strong>11</strong><br />
Figure 52 Rainwater Harvesting Potential in cubic meter (cum)