TCS Corporate Sustainability Report 2010-11 - Tata Consultancy ...
TCS Corporate Sustainability Report 2010-11 - Tata Consultancy ...
TCS Corporate Sustainability Report 2010-11 - Tata Consultancy ...

You also want an ePaper? Increase the reach of your titles
YUMPU automatically turns print PDFs into web optimized ePapers that Google loves.
Waste Management<br />
Due to the nature of our business, waste generation is fairly limited. There are dry wastes, wet<br />
wastes, e-wastes and a small quantity of hazardous waste. Our Waste Management practices<br />
seek to reduce the environmental impact of even this limited waste to the extent possible.<br />
Biodegradable waste<br />
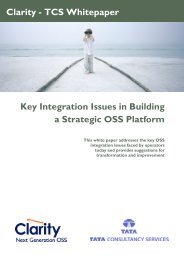
The wet and dry waste generated by the canteens at various <strong>TCS</strong> facilities went up even on a<br />
per-capita basis in FY 20<strong>11</strong>, but we believe much of this is due to ongoing improvements in<br />
data capture and reporting practices.<br />
25<br />
20<br />
15<br />
10<br />
5<br />
0<br />
The first step to any waste management practice is waste segregation at source. The hierarchy<br />
for disposal of biodegradable waste is biogas recovery through bio-digesters (methane<br />
avoidance) followed by vermicomposting, disposal as fodder to piggeries and, as a last resort,<br />
to the municipal garbage collection system where no other options are feasible.<br />
<strong>TCS</strong> has two bio-digesters, one at Mangaladas (Pune) and the other at Yantra Park, Mumbai.<br />
The methane generated from the bio-digesters is used as fuel in the Canteen Kitchen. More<br />
bio-digesters and organic waste composters will be installed at various locations in 20<strong>11</strong>-12.<br />
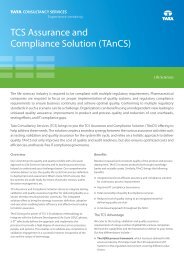
Our vermicomposting initiative is progressing well. 16 of our centers carry out composting,<br />
either in campus or at an external facility. Compost generated per month in FY 20<strong>11</strong> went up<br />
by 60% YoY.<br />
3,500<br />
3,000<br />
2,500<br />
2,000<br />
1,500<br />
1,000<br />
500<br />
Paper Recycling Initiative<br />
0<br />
8.0<br />
14.0 14.7<br />
2007-2008 2008-2009 2009-<strong>2010</strong> <strong>2010</strong>-20<strong>11</strong><br />
Figure 58 Waste Generated (Kg/FTE/yr)<br />
478<br />
Instead of going into landfills, paper waste is shredded and sent for recycling. In some<br />
cases, they are sent to NGOs which purchase the waste paper for a nominal amount and<br />
supply notepads made of recycled paper to <strong>TCS</strong>.<br />
In FY 20<strong>11</strong>, the recycling initiative progressed further. The number of <strong>TCS</strong> facilities recycling<br />
shredded paper waste went up to 52 (FY <strong>2010</strong>: 32). 78% of the total paper waste was sent<br />
for recycling in FY 20<strong>11</strong> (66% in FY <strong>2010</strong>).<br />
72<br />
1,290<br />
2,066<br />
19.9<br />
3,260<br />
2007-2008 2008-2009 2009-<strong>2010</strong> <strong>2010</strong>-20<strong>11</strong><br />
Figure 59 Compost generated (kg/month)